The last time Value took over from Growth was at the end of 2018, and even that was only for a short period going into and following the Christmas Crash. But that situation rapidly reversed a few weeks into 2019, when the uptrend in the Growth-Value ratio continued strongly.
If we isolate/ignore that short rotation into value, the big move in favor of Growth stocks started in Q1 2017. The last meaningful period that was in favor of Value starts at the end of 2015 and ends in Q1 2017 with a short hiccup into growth in October-November 2016.
The (long) chart below highlights the different periods favoring Growth or Value.

The small chart at the top is the S&P, for reference. The large second and third panes are $DJUSGR and $DJUSVA. The two panes at the bottom hold the Growth-Value ratio and the bottom pane holds the RRG-Lines of Growth vs. Value.
Here are a few observations which, I think, are important as we start moving into the second half of 2020.
First of all, the Growth index has convincingly broken to new highs, while the S&P itself and the Value index have not done so (yet). As a matter of fact, Value is well below its highs and seems to be struggling with resistance from the cluster of highs in the 3100 region.
This difference in performance has accumulated into a very strong and accelerating Growth/Value ratio, which even accelerated from February/March onwards when the coronavirus pandemic hit the world and the markets. Looking at that chart outright, there is no other conclusion possible than that we have a very strong trend at hand in favor of Growth stocks.
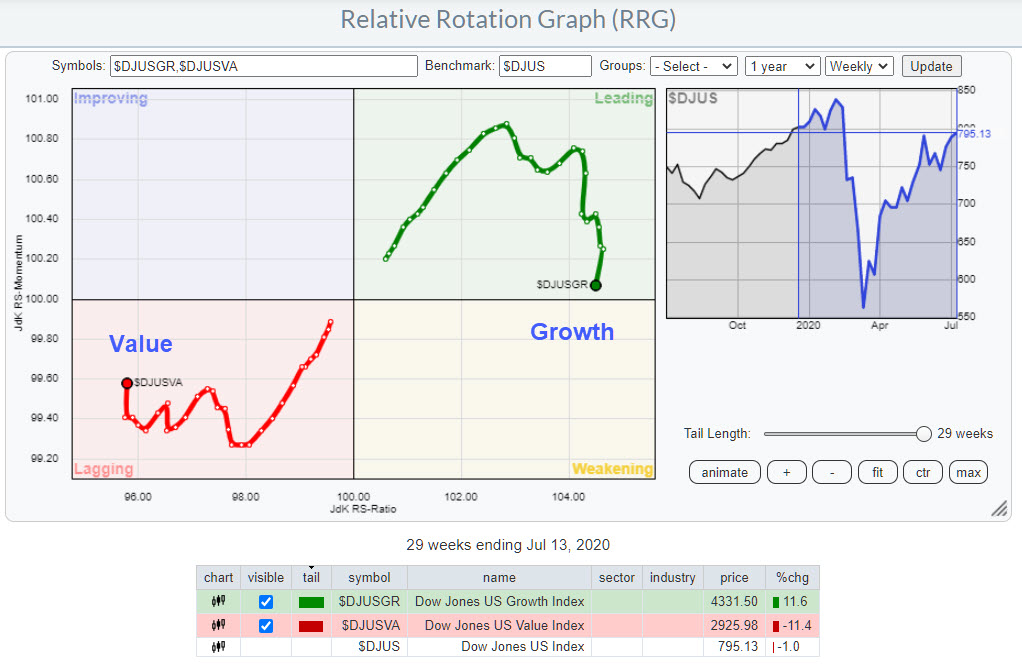
However, even very strong trends need some room to breathe. And that is what I see on the Relative Rotation Graph at the top of this article.
Said chart holds $DJUSGR and $DJUSVA with $DJUS as the benchmark. The distance between the end-points on the tail, measured on the JdK RS-Ratio axis, is massive and represents the high reading of the RS-Ratio line in the bottom pane of the price charts. The current heading of both tails show that Growth has started to lose relative momentum while Value has been gaining recently.
With the big distance from the tails to the 100-level on the RS-Ratio scale, and thus a long way to travel before Growth can hit the lagging quadrant or Value can hit leading, the odds seem in favor of a rotation to complete at the current side of the RRG - that is, Growth rotates through weakening, then curls back up into leading while Value rotates into improving and rolls over back to lagging.
I have to admit that it is a bit of an educated guess, as the market will eventually dictate the trends and the RRGs will follow those trends. And I would then usually do the same... but when we want to take a peek and roll the dice on what could happen in the next six months, my scenario is for Growth/Value to continue its current rotation in favor of Value stocks for a few weeks to a few months, before then turning back in favor of Growth stocks.
This assumption or scenario now leads to the question of whether the S&P will be able to hold up, or maybe even rise from current levels, while this Growth/Value scenario usually plays out in weak(er) market conditions, or...
In the panel discussion that will wrap up this theme-week at StockCharts TV on Saturday 18th July, I will try to make an educated guess on that subject while using the RRG for US sectors.
Please tune in Saturday 18th July 12pm ET. You can watch the live broadcast on the StockCharts TV livestream or at the StockCharts.com YouTube channel.
#StaySafe, --Julius
My regular blog is the RRG Charts blog. If you would like to receive a notification when a new article is published there, simply "Subscribe" with your email address.
Julius de Kempenaer
Senior Technical Analyst, StockCharts.com
Creator, Relative Rotation Graphs
Founder, RRG Research
Host of: Sector Spotlight
Please find my handles for social media channels under the Bio below.
Feedback, comments or questions are welcome at Juliusdk@stockcharts.com. I cannot promise to respond to each and every message, but I will certainly read them and, where reasonably possible, use the feedback and comments or answer questions.
To discuss RRG with me on S.C.A.N., tag me using the handle Julius_RRG.
RRG, Relative Rotation Graphs, JdK RS-Ratio, and JdK RS-Momentum are registered trademarks of RRG Research.
