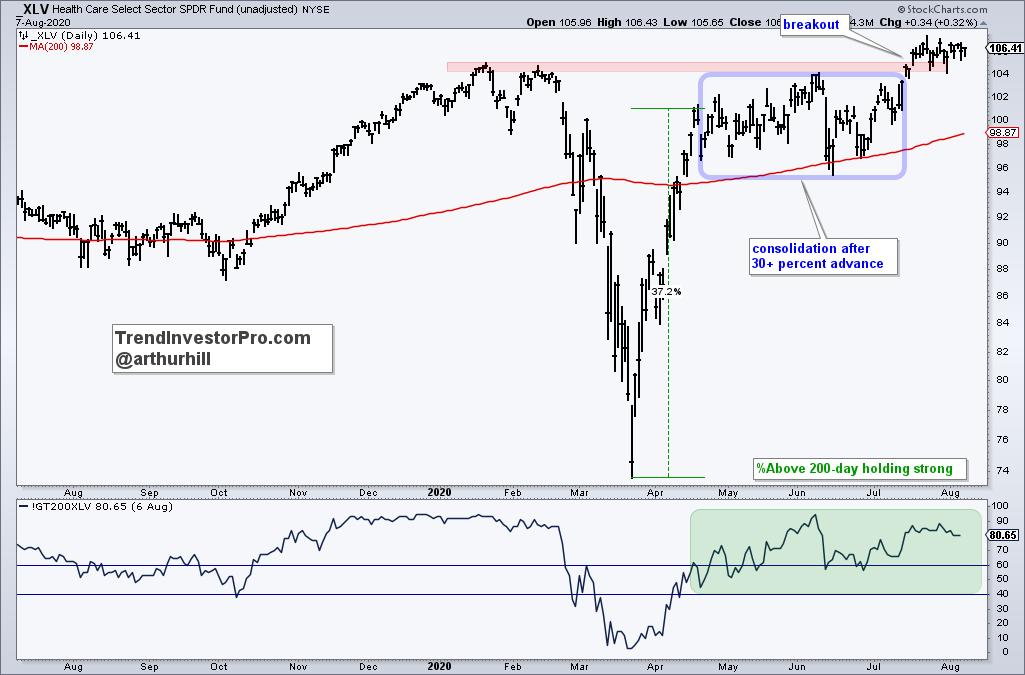
 The Healthcare SPDR (XLV) is one of the strongest sectors in 2020. Even though it does not sport the biggest gain, XLV recorded a new high in July and some 80% of its components are above their 200-day EMAs. The new high points to a long-term uptrend and upside leadership, while the percentage of stocks above the 200-day EMA points to broad strength within the sector. Sector SPDRs, however, are only as strong as the sum of their parts (component stocks). The top four stocks in XLV account for 27.7% of the ETF and these four look poised for further gains.
The first chart shows XLV surging over 30% and then consolidating from mid April to mid July. A consolidation after a sharp advance is typically a bullish continuation pattern and XLV broke out with a surge to new highs in mid July. This breakout signals a continuation of the existing uptrend and further gains are expected. Also note that price is above the rising 200-day and %Above 200-day EMA (!GT200XLV) has been bullish since above crossing 60% in mid April.
Now lets check out the big four. The next chart shows Johnson & Johnson (JNJ) with a breakout in July and UnitedHealth (UNH) with a breakout this week. Actually, UNH is the stronger of the two because it recorded a new high this week. Nevertheless, JNJ held its rising 200-day in June, broke out of a falling channel correction and remains above its 200-day.
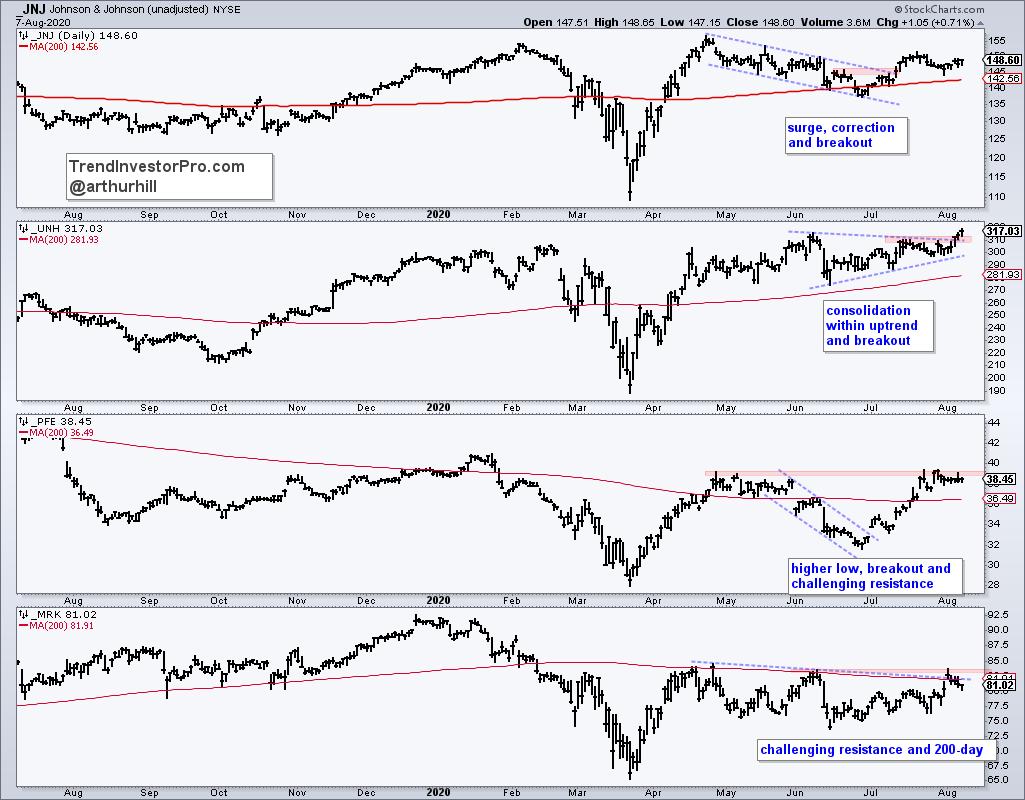
Pfizer (PFE) and Merck (MRK) are not quite as strong as the first two, but both are challenging resistance zones. PFE formed a higher low in late June, broke out of a falling channel and raced to the resistance zone. A breakout here would forge a higher high to go along with the higher low. MRK surged to its 200-day in April and then worked its way lower the last few months. There is resistance in the low 80s from the 200-day and June-July highs. A breakout here would reverse the downtrend.
Sign up bonus! StockCharts members who sign up for TrendInvestorPro.com receive the Essential Breadth Indicator ChartList. This list contains over 100 charts organized by index and sector with their respective breadth indicators. New subscribers also receive the Core and Master ETF ChartList, which contains over 200 ETFs organized in a top-down manner. Each week we rank, group, chart and analyze the core list of 60 ETFs. There is also a broad market timing report on Friday's with quantified breadth models and a weekend video putting it all together.
Click here to take your analysis to the next level!
--------------------------------
Choose a Strategy, Develop a Plan and Follow a Process
Arthur Hill, CMT
Chief Technical Strategist, TrendInvestorPro.com
Author, Define the Trend and Trade the Trend
Want to stay up to date with Arthur's latest market insights?
– Follow @ArthurHill on Twitter
