It seems remarkable that, every week, the market moves higher regardless of public health deterioration, rising death rates, politics, increasing global conflict, falling earnings and rising bankruptcies. But, more importantly, the only thing telling us which side of the investing landscape to be on is the price action. There is very little helping us with words of encouragement on the news flow.
Mega-cap names have soared for 4 months, as if they had a product they did not have before. Apple (AAPL) is still selling what it was selling, Microsoft (MSFT) is still selling what it was selling, Facebook (FB) is still selling what it was selling. Google (GOOG) is still selling what it was selling. Really, Amazon (AMZN) is the only one where business flow has had a remarkable upside turn. Banks are muted by interest rates, but they are also the only and primary conduit for Fed and Government programs. Why haven't they soared? Bitcoin ($BTCUSD) currency is breaking out, while the dollar falls. Gold and Silver soar, as some sort of marginal ballast to exploding government debt globally. Retailers are in a paradox between bankruptcies and soaring revenues for online offerings. Railways and trucking continue to move higher as the media reports areas of the country slowing. The payment systems area has exploded higher, with SQ and PYPL as examples, but Mastercard (MA) and Visa (V) can't get through prior highs.
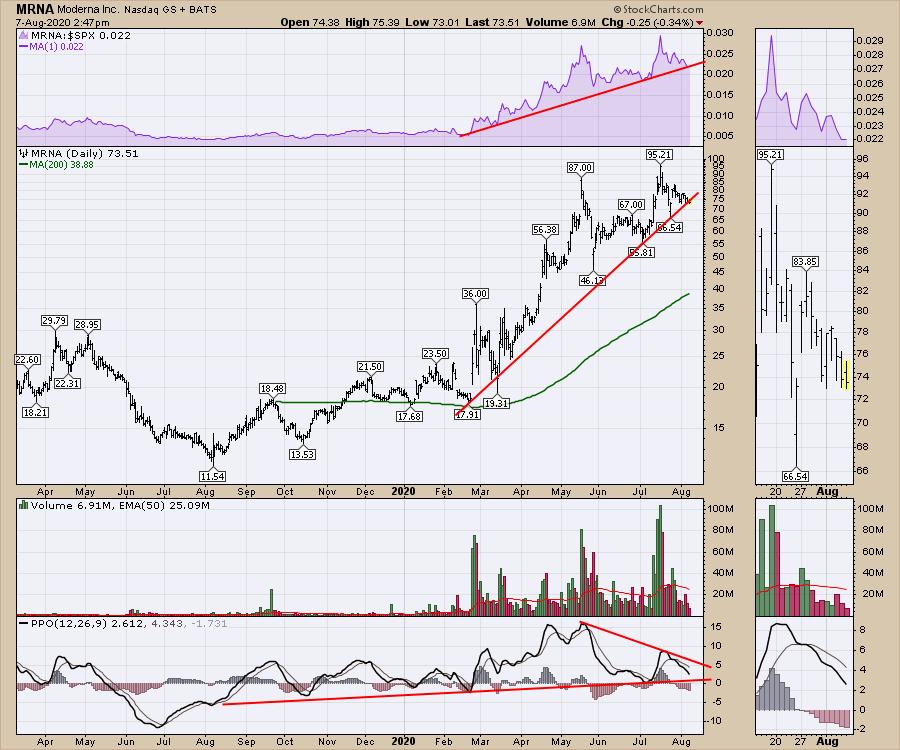
It's a challenging investment landscape, where the only clues we have are prices paid. Strength has led to strength. The companies that broke out early have continued to push higher. Some ballistic surges in TSLA, NKLA, NIO have only amped up speculation. The Biotech industry is like a ride on Space Mountain, a roller coaster in the dark where every curve illuminates some new vaccine idea, while what was showing up is overshadowed by the new view.
In the meantime, my Twitter feed shows advisor after advisor suggesting to stay the course, it's a long-term plan. My LinkedIn is all about how people who got out to protect their capital were foolish and sticking with a plan was the right thing to do. At this point, it is hard to argue as staying invested was the right thing to do.
The unstated central thesis for portfolio managers worldwide is you just had to believe that every municipal, state and federal government worldwide would take on immeasurable risk and throw money they didn't have at the problem at the fastest rate of unplanned debt expansion ever. The central banks would buy junk bonds, corporate debt and bizarre "assets," and go on the fastest surge in spending ever. Countries like Japan would add two trillion in debt while unable to service the largest debt ratio in the developed world. In the words of Mario Draghi, whatever it takes. Now, we are waiting for the next round of stimulus checks so the global economies don't stall again. Truly, even more remarkable.
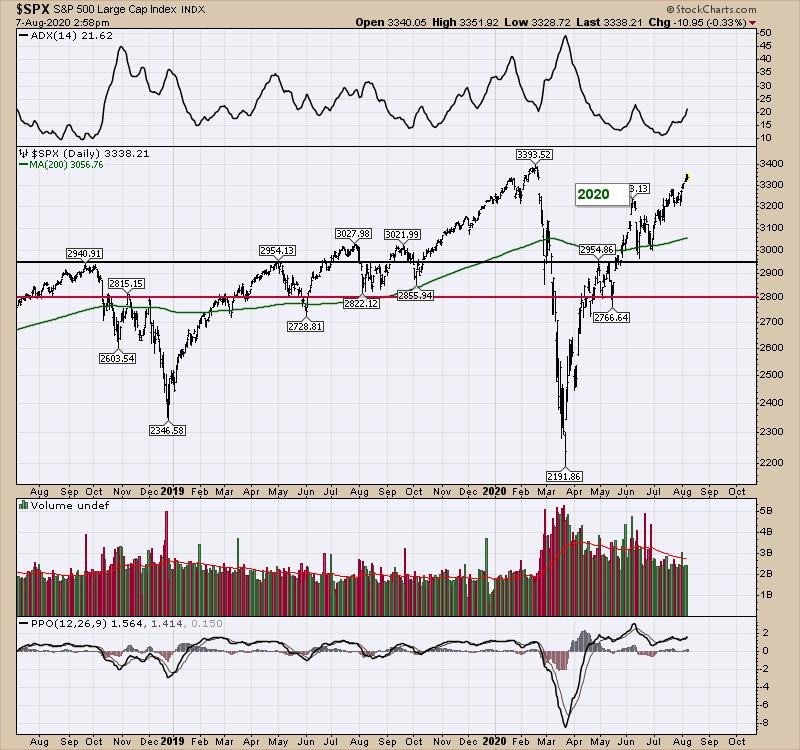
As the $SPX is coming back to test the old February highs, is this the deja vu of the year 2000? Being aware of the chart shapes can help ballast our optimism. After all, we wiped out the global economy and brought it back to some shadow of its former self, but is the world worth so much more now that markets continue to higher highs?
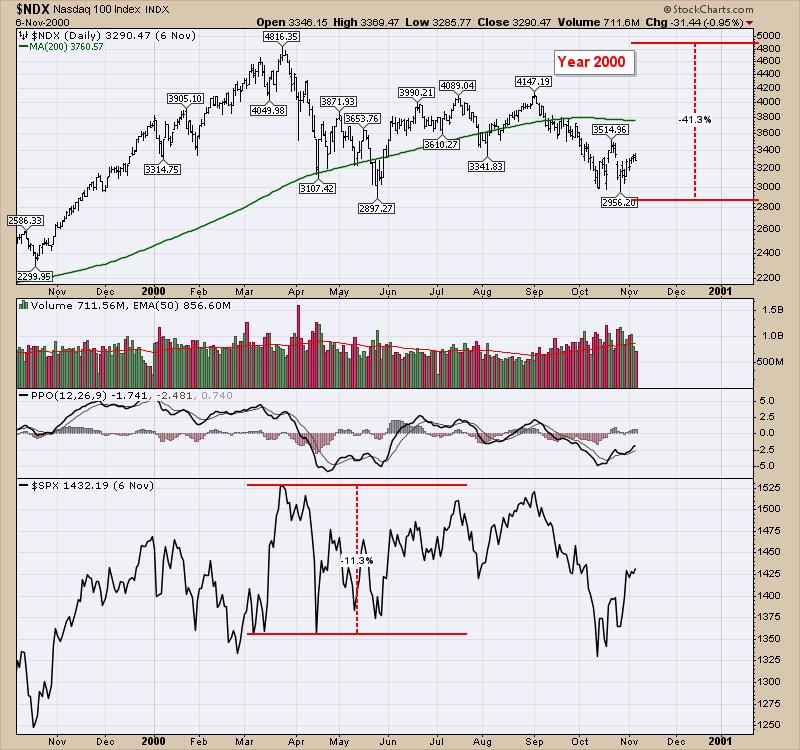
Here's how 2000 looked on the $NDX. The lesson to be learned on the chart that is valuable is that the market rallied significantly off the lows and took about 6 months to lose the euphoria in the rallies. The absolute levels are valid, but may be higher or lower than the previous highs before the primary correction. In 2000, the market topped in March and again in September. The $SPX (lower panel) went back to test prior highs, but did not get through. There is no reason to suggest this would be the same, but let's at least be aware of historical reactions as the market keeps trying to move higher.
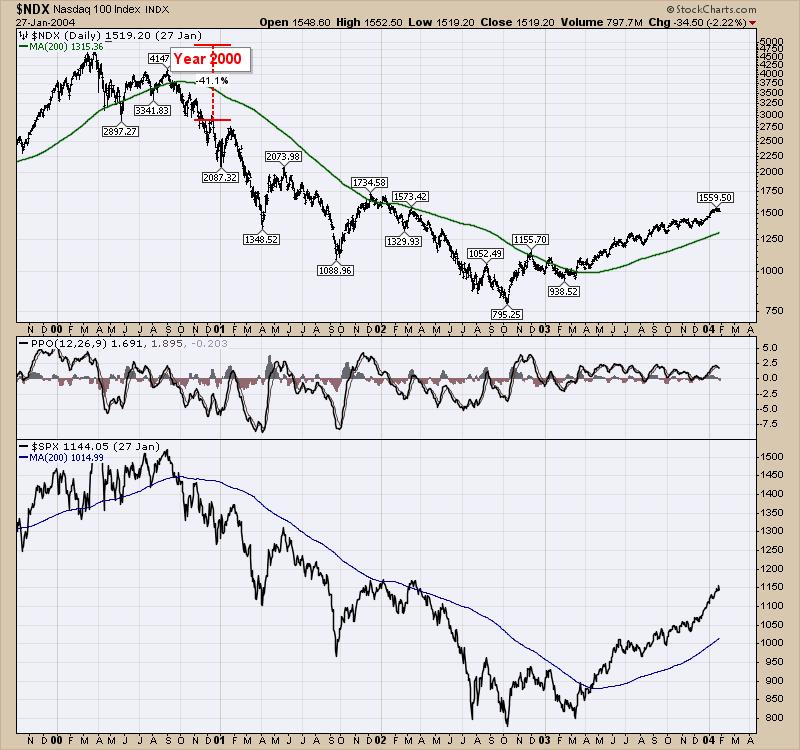
Here is how that played out after the initial 6 months of rebuilding confidence. We see the same trend of complacency creeping in with fresh lows in options market pessimism (not shown).
We don't know if we can just keep having companies growing at 12.8% per year, trading at 37 times earnings (MSFT) as the new normal, or if it will end up with a global slowdown when all the facts come out and we melt down into a big slowdown.
I have a series of charts that keeps me invested now, but will also push me to the exits should they start to fail. They currently say to keep on holding. My comfort level that this was the world's greatest recovery is way lower than the current level of the Nasdaq. It won't matter if I am right or wrong; it will only matter if I don't follow the technical clues the market is sharing.
All that is to say, the news flow would scare us out of the market every day, but make us feel like we missed the moves by not being invested. At this point, I would suggest the market has been the kindest market ever to let us reevaluate the selloff by returning to prior highs. With the $SPX only a day away from prior highs, it's a good time to check the Kool-Aid we are drinking to make sure reality is nearby if required.
Good trading,
Greg Schnell, CMT, MFTA
Senior Technical Analyst, StockCharts.com
Author, Stock Charts For Dummies
Want to stay on top of the market's latest intermarket signals?
– Follow @SchnellInvestor on Twitter
– Connect with Greg on LinkedIn
– Subscribe to The Canadian Technician
– Email at info@gregschnell.com
