The recent pullback in high-growth stocks has created some unique opportunities to purchase select growth names at a discount. Before considering this strategy, however, it's important to make sure that several characteristics are in place.
To begin, you'll want to reduce uncertainty by making sure the company has already reported their most recent quarterly earnings and that these earnings were better than expected. This, coupled with positive guidance from management going into year-end and beyond, will help put you in front of ideal candidates.
These positive growth prospects are going to be the primary driver of the stock going higher.
Next up, you'll want the stock to be a part of a strong industry group or sector. In other words, the company provides products or services that are being met with high demand not only currently, but going forward as well. Below is a chart of the Semiconductor Industry, which is in a very confirmed uptrend as demand for chip stocks has been particularly strong.
DAILY CHART OF SEMICONDUCTOR ETF (SOXX):
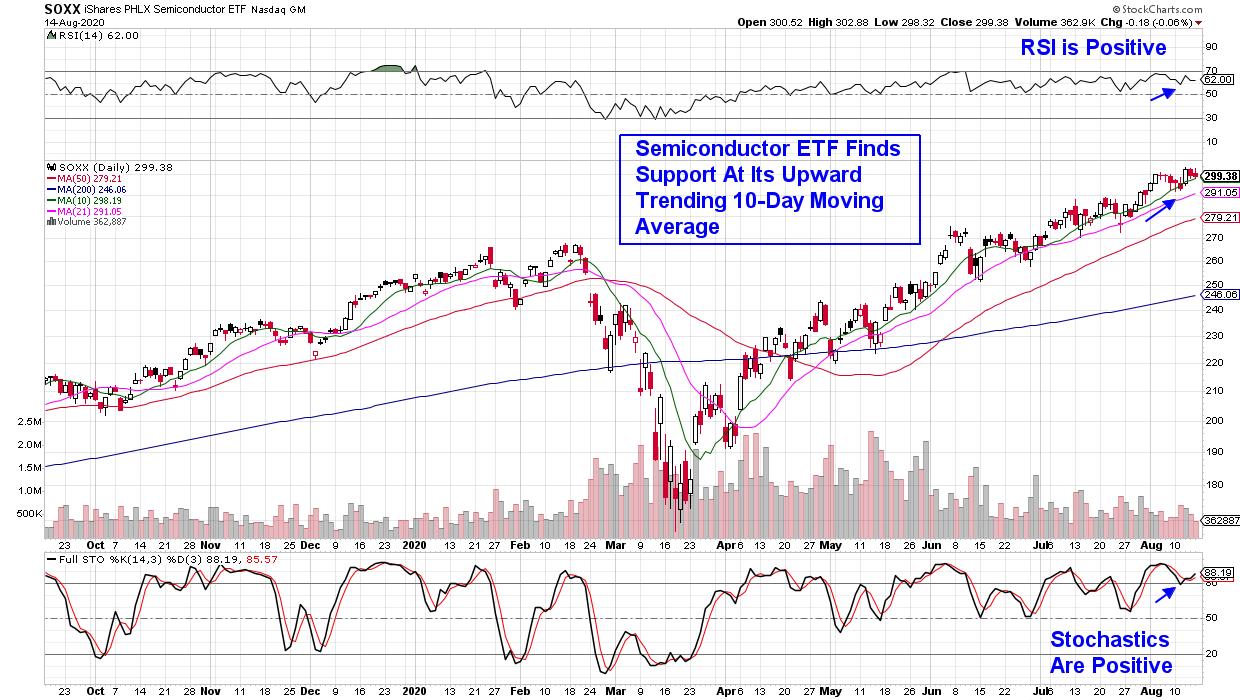
Lastly, and of particular importance, you'll want to make sure that the stock is finding support at its key simple averages, that are in an uptrend. This last item can carry the most weight as it will provide the most guidance regarding the near-term prospects for your stock.
Below is a daily chart of KLA Corporation (KLAC), which is a Semiconductor Equipment supplier that reported earnings and sales late Monday that beat Wall Street's targets for its fiscal fourth quarter. Management also guided higher for their current quarter.
DAILY CHART OF KLA CORP. (KLAC):
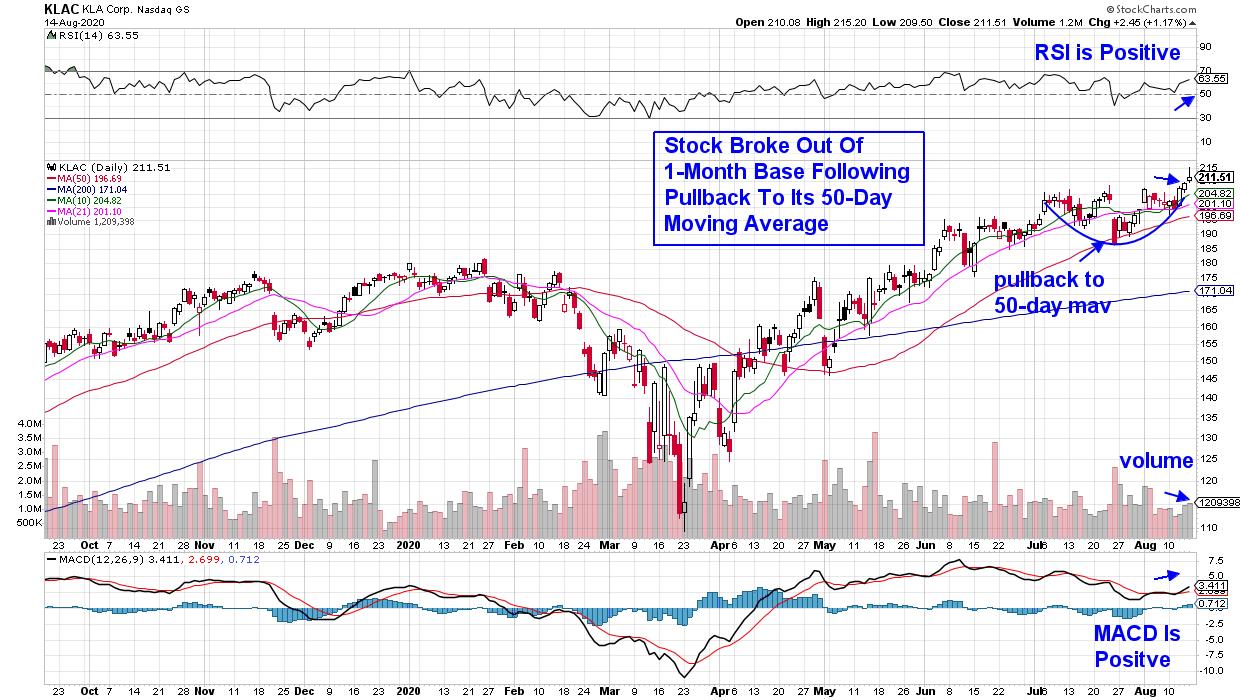
KLAC pulled back to its upward-trending 50-day moving average late last month before its more recent bullish break back above its shorter term 10-day moving average (green). The company's positive earnings and sales report helped push the stock out of a 1-month base on volume, with the RSI and MACD in positive territory. This is very constructive.
On the other side, below is an example of a stock that's also from the leading Semiconductor industry however, this stock did not find support at its key 50-day moving average. The break below key support indicates that the recent pullback in FORM is more, and the stock is likely heading lower.
DAILY CHART OF FORMFACTOR INC. (FORM):
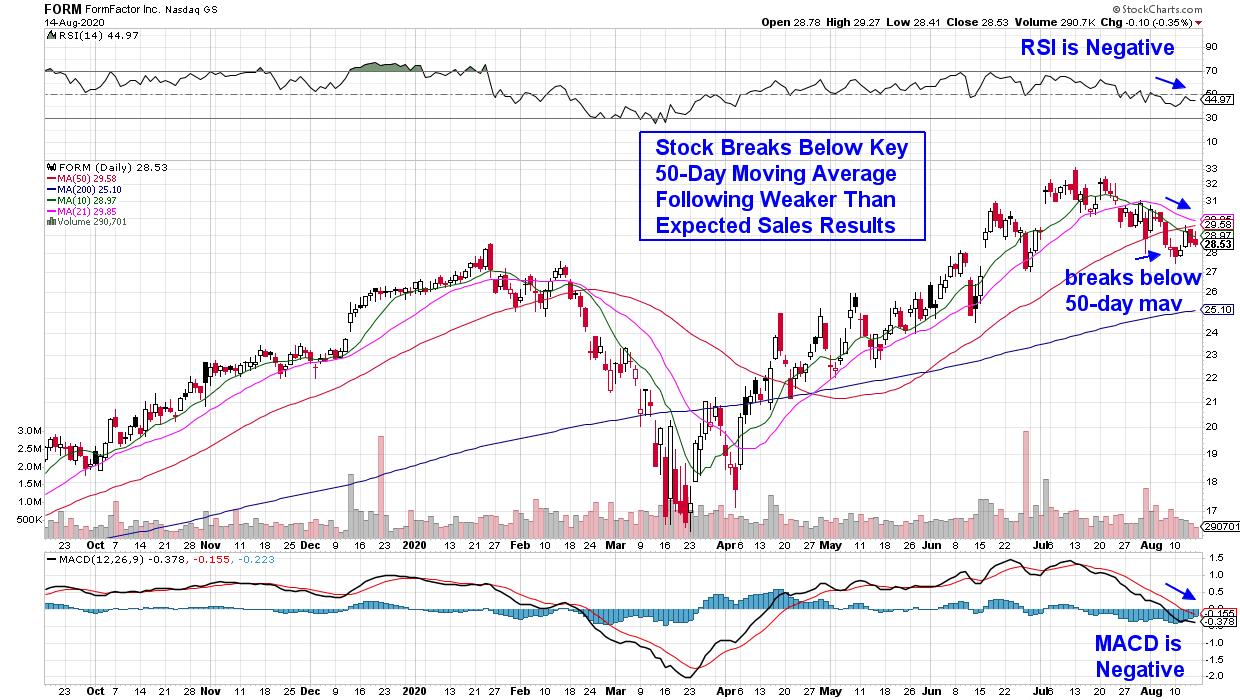
In addition to breaking below key support, the RSI and MACD for the stock are in negative territory following the company's report of weaker-than-expected sales. Each of these weak technical and fundamental signals point to a lagging stock within a leading industry.
Semiconductor stocks entered the bear market with strong growth prospects that have only gotten stronger during this historic pandemic. These chips are needed in many vital industries, including digital cloud computing centers that allow remote workers to remain connected, as well as the expansion of 5G networks that allow this data to move faster.
I've identified the top Semiconductor chip providers in my bi-weekly MEM Edge Report and, if you'd like access to these key stocks poised to trade higher, take a 4-week trial for a nominal fee. This top-performing report will also point you toward leading cyclical stocks that are currently moving into favor. Click Here to make sure you receive this Sunday's report!
Warmly,
Mary Ellen McGonagle. MEM Investment Research