
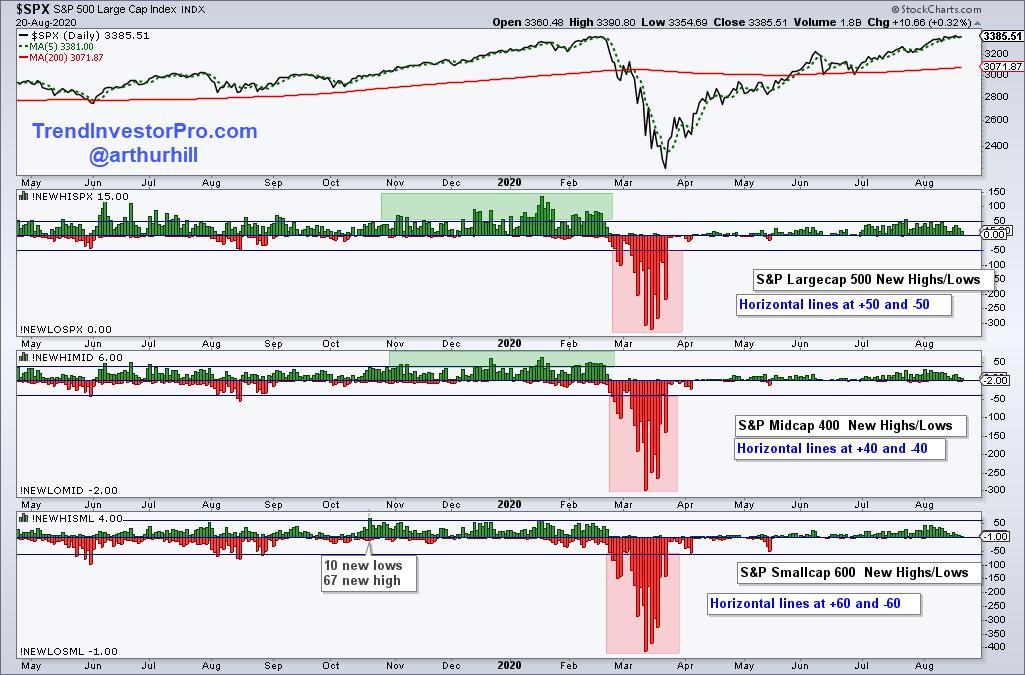
The total number of new highs in the S&P 500, S&P MidCap 400 and S&P SmallCap 600 continues to underwhelm. Even so, new highs are still outpacing new lows and this is enough to keep the uptrend since late March going.
The first chart shows new highs and lows for the three indexes with horizontal lines at the 10% level (e.g. 50 and -50 for the S&P 500). New highs in the S&P 500 exceeded 50 in mid July, but remain well below the levels seen in December, January and February (green zone). New highs for the S&P MidCap 400 have yet to exceed 40 and new highs for the S&P SmallCap 600 have yet to exceed 60. Again, mid-caps and small-caps are lagging overall.
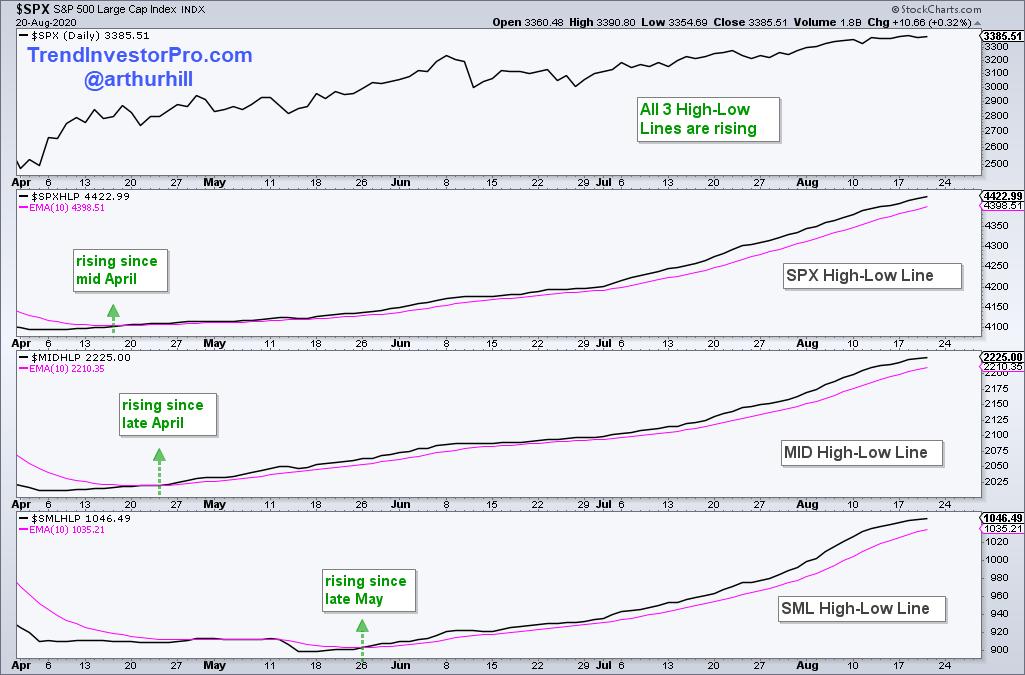
We can track cumulative net new highs with the High-Low Lines based on High-Low Percent, which is new highs less new lows divided by total issues. The High-Low Lines rise as long as new highs outpace new lows, regardless of the total number of new highs. The chart below shows the S&P 500 High-Low Line rising since mid April, the S&P MidCap 400 High-Low Line rising since late April and the S&P SmallCap 600 High-Low Line turning up in late May. All three are rising and this is bullish until two of the three turn down (break their 10-day EMAs).
Looking for more breadth indicators? Subscribe to TrendInvestorPro.com and get the Essential Breadth Indicator ChartList. This list contains over 100 charts with dozens of breadth indicators. It is organized by index, sector and breadth group. This makes it easy to analyze the breadth indicators and separate the leaders from the laggards.
Click here to take your analysis to the next level!
--------------------------------------------------
Choose a Strategy, Develop a Plan and Follow a Process
Arthur Hill, CMT
Chief Technical Strategist, TrendInvestorPro.com
Author, Define the Trend and Trade the Trend
Want to stay up to date with Arthur's latest market insights?
– Follow @ArthurHill on Twitter


