Last week, I wrote an article titled "What Can We Learn From Equal Weight vs. Cap Weighted Rotations on RRG". In that article, I touched upon distortions between EW and CW sector ETFs because of the large and increasing weight of a few Mega-Cap stocks.
In this week's episode of Sector Spotlight, I showed how to subdivide the Technology sector into industries on a Relative Rotation Graph, then proceeded to zoom in on the Technology Hardware, Storage & Peripherals Index, which includes AAPL, to show the impact.
Mega-Cap Dominance
With the fast and continuing rise in mega-cap stocks like AMZN, GOOG, FB and AAPL, the sector ETFs that include these stocks get dominated by the movement of those stocks. As a result, these cap-weighted ETFs are no longer as good a representation of the sector as they used to be.
Due to those moves, the single-stock risk in these cap-weighted ETFs has increased significantly. Avoiding that single-stock risk is one of the most important reasons for investors to trade/invest in ETFs, so that they don't have to worry about that.
Breaking Tech Down Into Industries
If we break down the Technology sector (XLK) into its industries and put these on a Relative Rotation Graph, this is what we get:
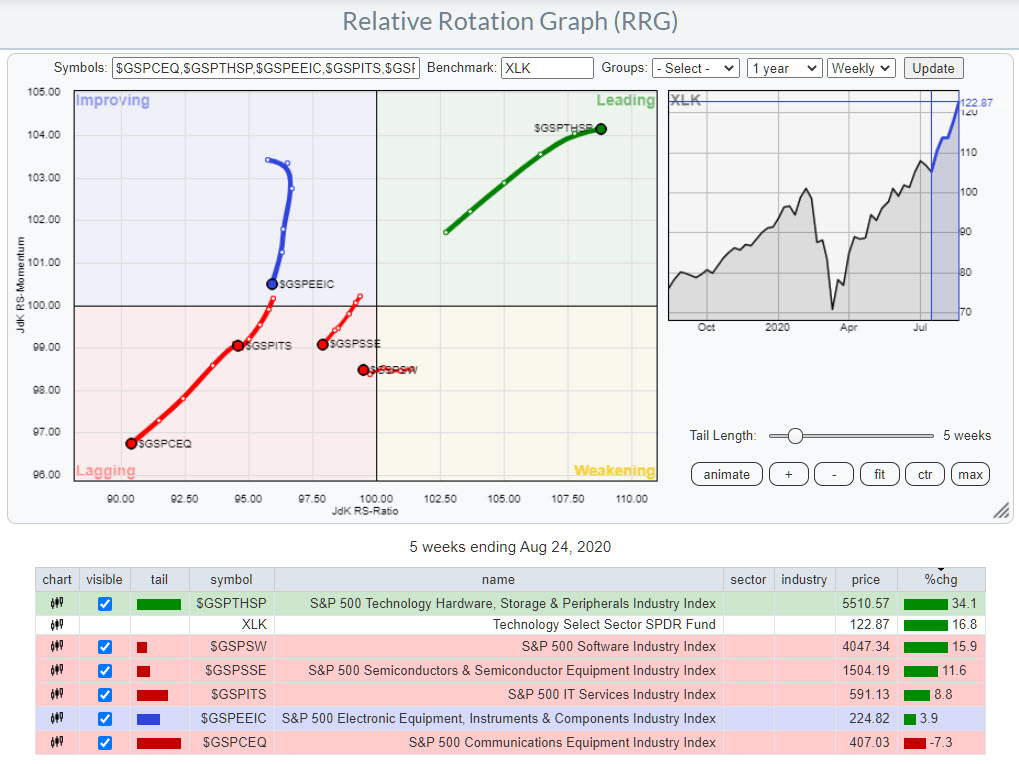
These six industries together make up the Information Technology sector as it is tracked by XLK. One industry is shooting off into the leading quadrant, while all five others are either inside the lagging quadrant or on the way to it.
But look at the performance % in the table below the image. Five out of the six groups are showing seriously positive gains over the last five weeks, but $GSPTHSP is blowing everything else out of the water with a gain that is more than twice as big as the second in line, the Software Industry.
You get one guess to tell me which group AAPL belongs to. ;) The disconnect is already showing up in this RRG, but things get even more clear when we break down these industries into their individual stocks.
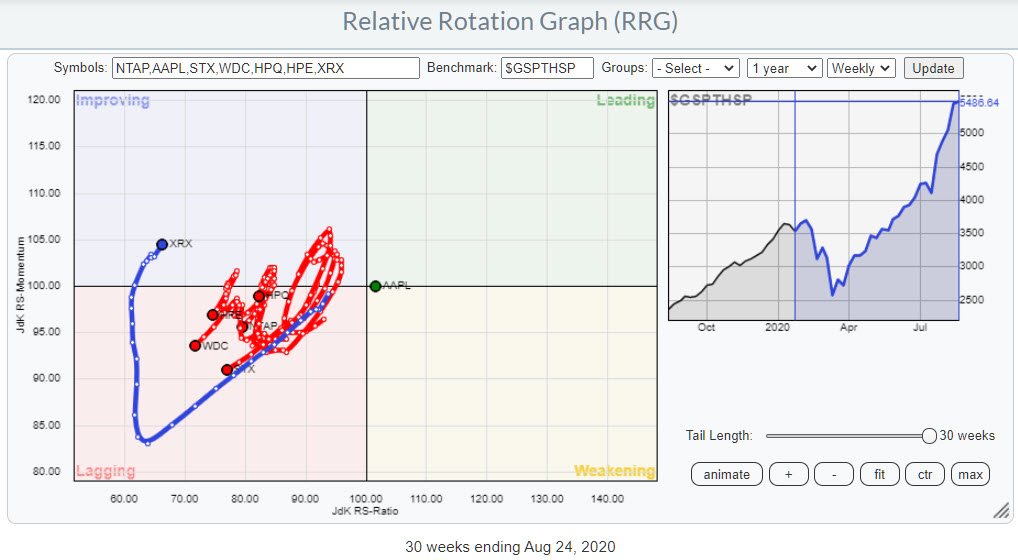
The RRG above shows the rotation of the seven stocks that are in the Technology Hardware, Storage & Peripherals Industry. I have deliberately lengthened the tails to 30-weeks and, believe it or not, all symbols on this RRG have a 30-week tail. Even AAPL!!
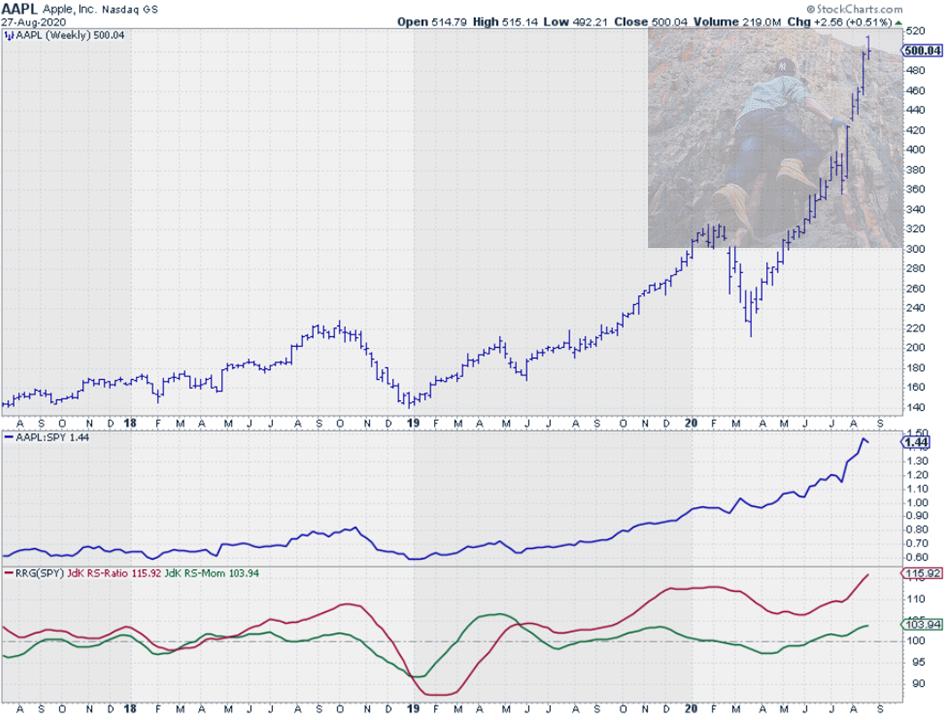
Single Stock Risk for AAPL Increasing
The fact that AAPL is close to the center of the chart, has been so for 30 weeks and remains almost stationary illustrates and underscores how dominant this stock is inside this industry.
In order to see that AAPL did actually move around, a little bit, over this 30-week period, we have to delete all names from the chart and only keep AAPL and the benchmark.
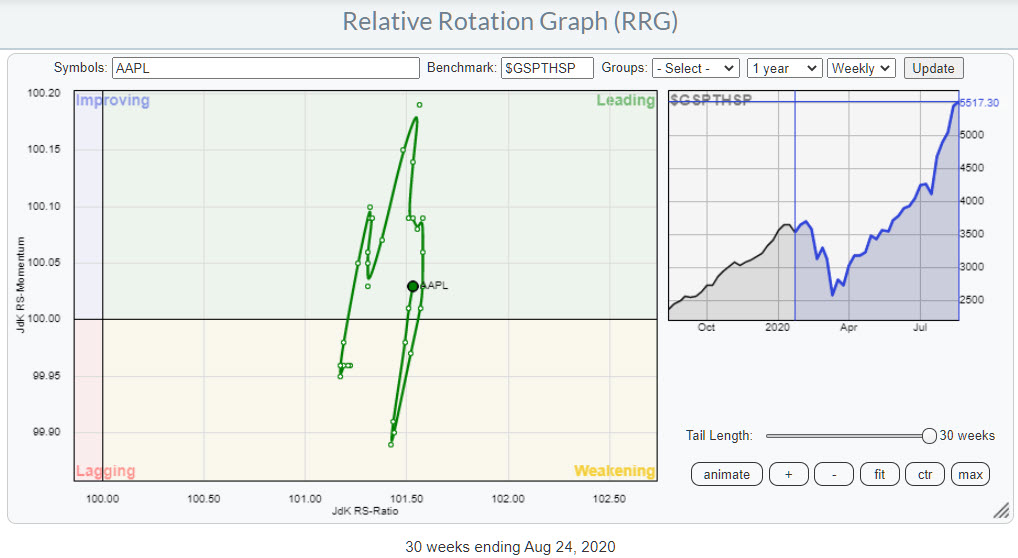
This is essentially a very magnified and zoomed-in image of the space around AAPL as we saw it in the first RRG, where AAPL looked like a single dot.
Divergence Between XLK and RYT
Of course, the impact of a single stock is much bigger in a small group, like $GSPTHSP, but it is definitely also showing up at the sector level.
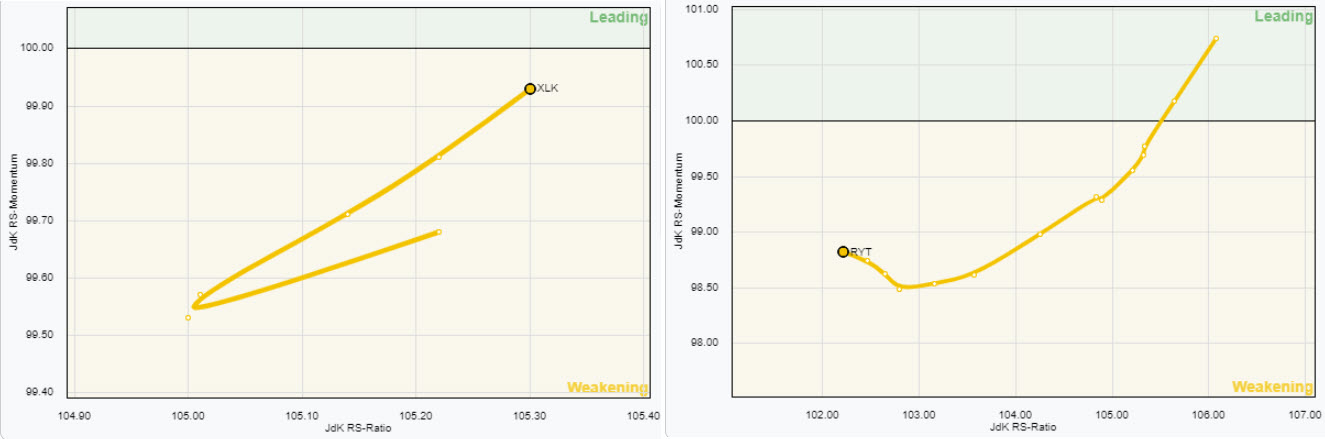
The two RRGs above show the rotations for XLK, the cap-weighted technology ETF, and RYT, the equal weight technology ETF, side by side. The different trajectories are clearly visible.
Both tails are positioned inside the weakening quadrant, but XLK has rotated back up and is now heading back towards the leading quadrant. RYT has shrugged off the loss of relative momentum in the last few weeks, but is still moving lower on the RS-Ratio scale. We need more improvement here for RYT to turn back up to a positive RRG-Heading.
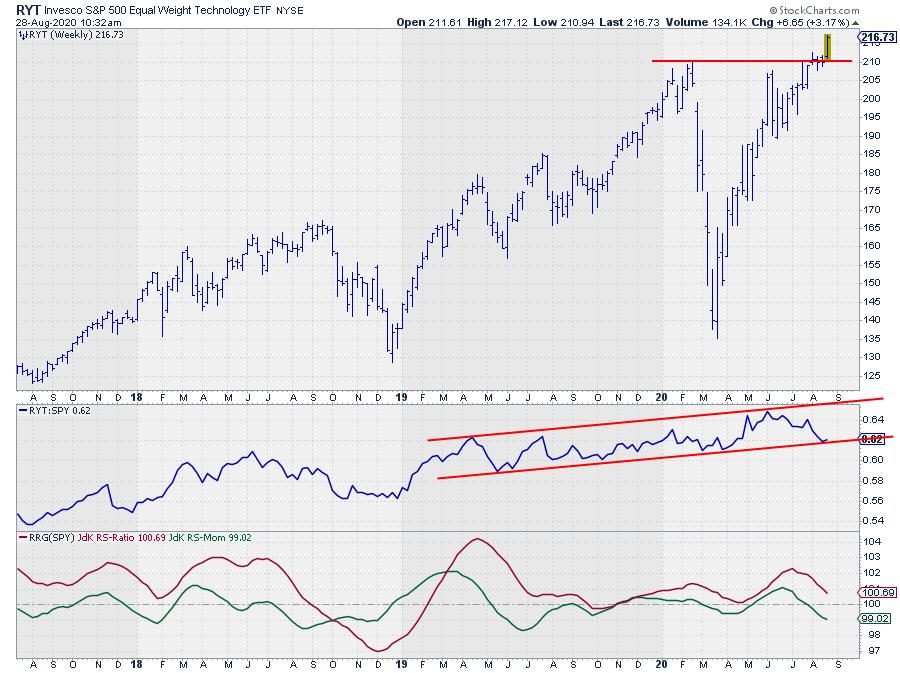
The good news is that RYT has recently broken out above its early 2020 peak, which should give the rally some new fuel and enable a rotation back towards the leading quadrant. Such a rotation would absolutely be good news for the market, as it means that the base for the improvement in the technology sector is getting broader, more reliable and less dependent on the performance of AAPL.
So, all in all, the technology sector is still looking good on a broader base, but, for the time being, remains dominated by AAPL.
Investors who want to take the single-stock risk for AAPL out of their ETF portfolio may want to consider swapping XLK for RYT.
In this way, you remain invested in the sector, but with a more balanced portfolio and less exposure and therefore less risk to AAPL.
#StaySafe, --Julius
My regular blog is the RRG Charts blog. If you would like to receive a notification when a new article is published there, simply "Subscribe" with your email address.
Julius de Kempenaer
Senior Technical Analyst, StockCharts.com
Creator, Relative Rotation Graphs
Founder, RRG Research
Host of: Sector Spotlight
Please find my handles for social media channels under the Bio below.
Feedback, comments or questions are welcome at Juliusdk@stockcharts.com. I cannot promise to respond to each and every message, but I will certainly read them and, where reasonably possible, use the feedback and comments or answer questions.
To discuss RRG with me on S.C.A.N., tag me using the handle Julius_RRG.
RRG, Relative Rotation Graphs, JdK RS-Ratio, and JdK RS-Momentum are registered trademarks of RRG Research.


