Big tech has been the main story in the market since the start of the pandemic with most of the rest of the market largely left behind. Over the past couple of weeks, however, we've started to see some money moving into weaker parts of the stock market that have been lagging behind. So it's encouraging to see some of the those groups continuing to gain ground as some profit-taking emerges in an overbought technology sector. Some of those moves can be seen in today's sector alignment. Chart 1 shows technology and communications as Friday's weakest sectors, while money flowed into utilities, financials, industrials, and real estate. In addition to those four leading sectors, small caps and transports are gaining more ground on Friday. A bounce in bond yields may be giving a boost to bank shares. Chart 2 shows the whole week's performance.
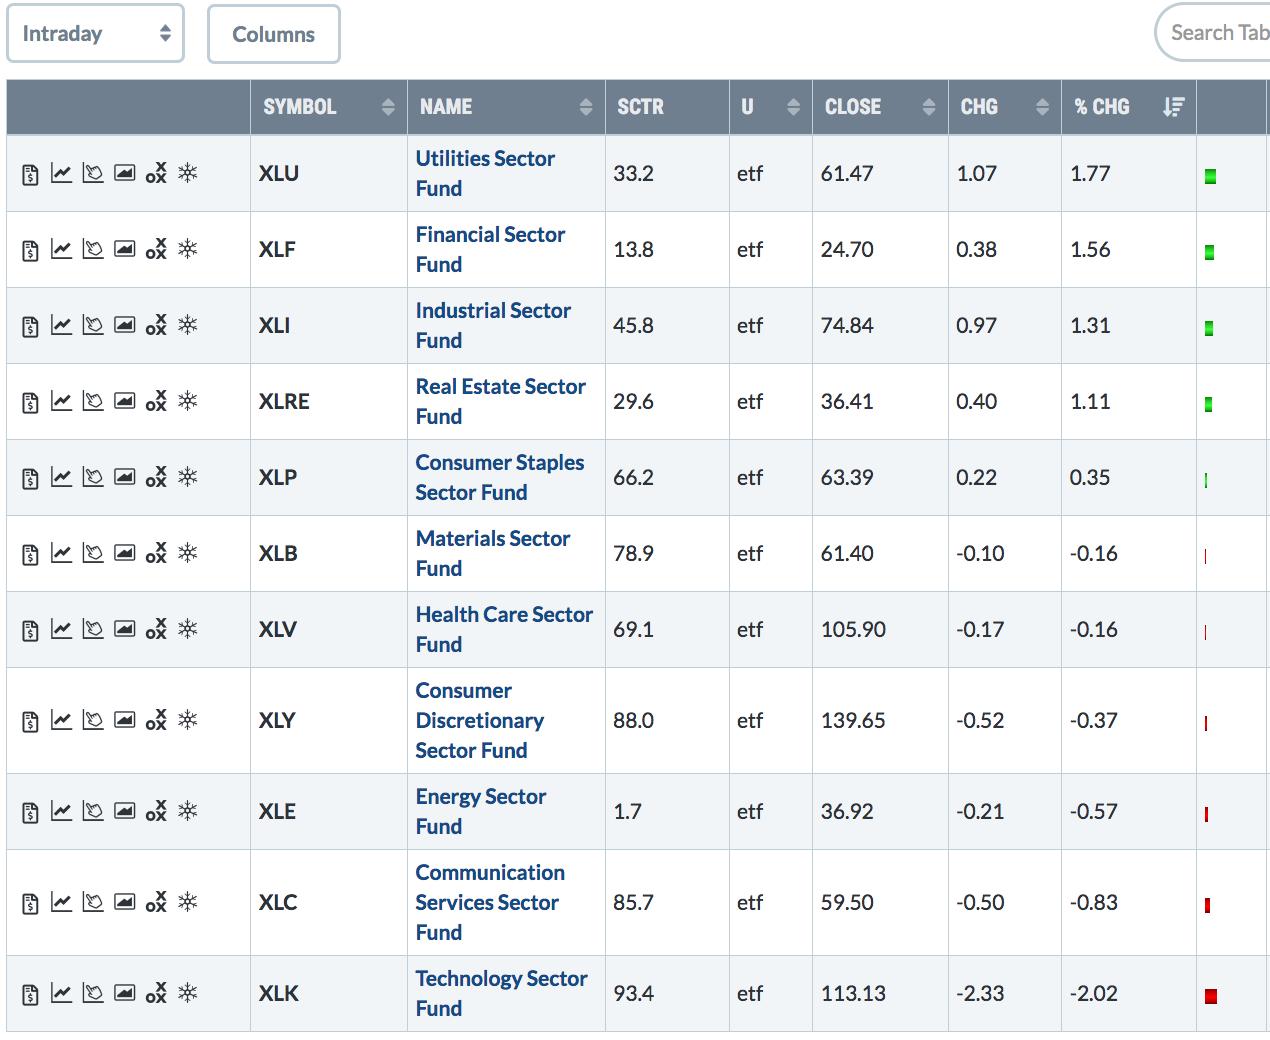 Chart 1
Chart 2 ranks the eleven market sectors for the entire week. And it shows industrials in the top spot. The XLI cleared its 200-day moving average this past week and is starting to attract more attention and money. Its top gainers were in delivery services like UPS and FedEx along with heavy construction, airlines, and aerospace. Technology came in third. Defensive staples, utilities, and real estate were among the weakest sectors. Some of the money moving into cheaper parts of the market may be coming from technology. But some of it may be new money coming from the sidelines. The S&P 500 is within one percent of its February high which may provide an important test for the overall stock market (see Chart 5). In related markets, a bounce in an oversold dollar is causing profit-taking in overbought precious metals.
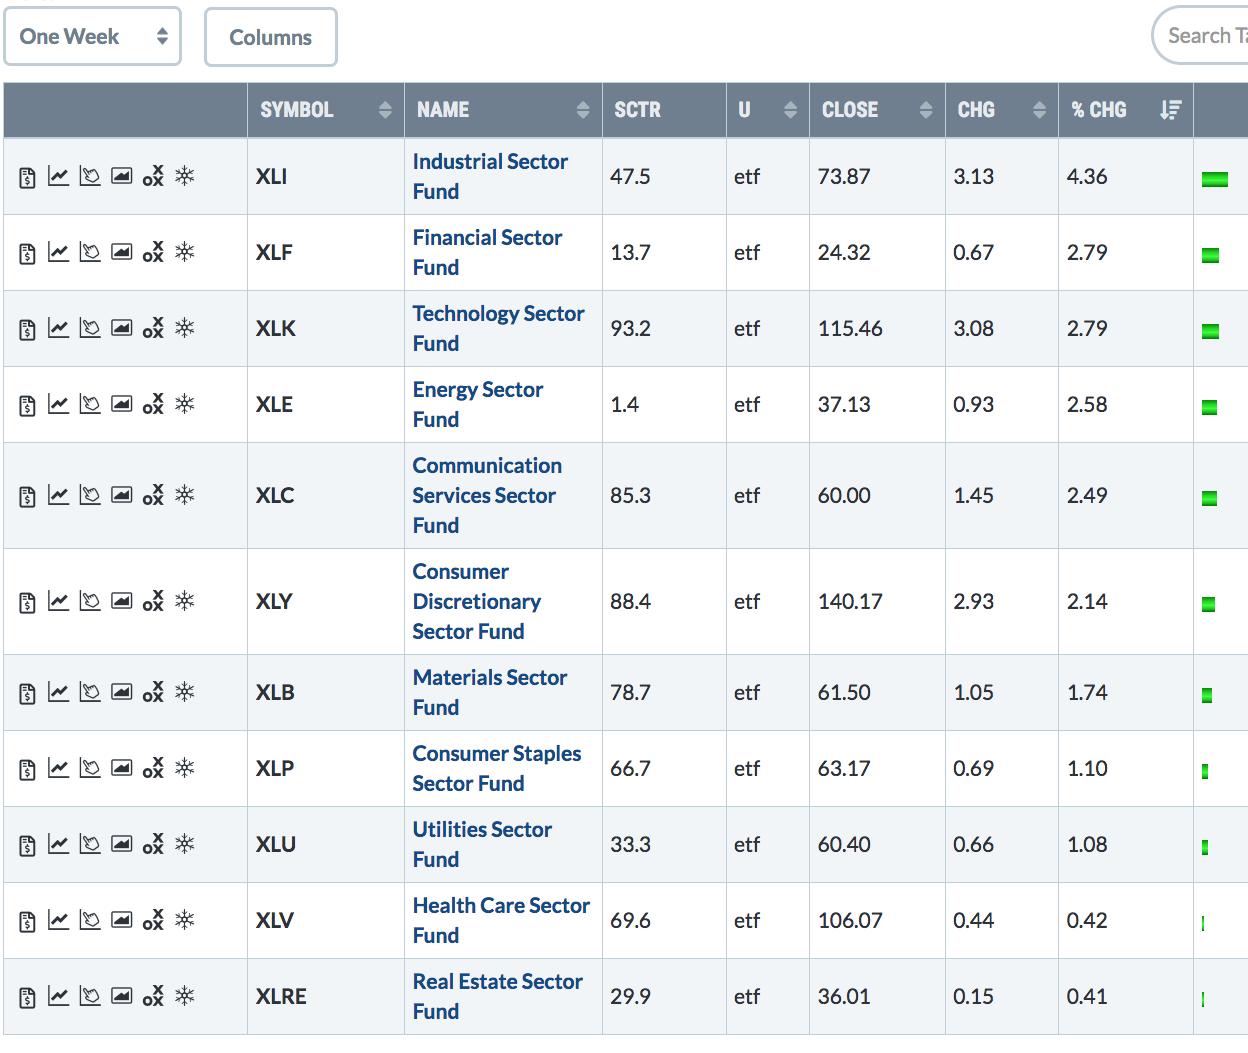 Chart 2
United Parcel (UPS) and FedEx (FDX) are the day's two top percentage gainers in the Industrial SPDR (and the Dow Transports). Last weekend's message showed UPS surging to a new record. FedEx has a long way to go to reach that milestone. The daily bars in Chart 3, however, show the delivery stock hitting a new 52-week high today. The weekly bars in Chart 4 put that upturn in better perspective and suggest that its new uptrend may be just beginning. The upper chart shows UPS scoring another record high today. Chart 5 shows the S&P 500 nearing an important test of its February high.
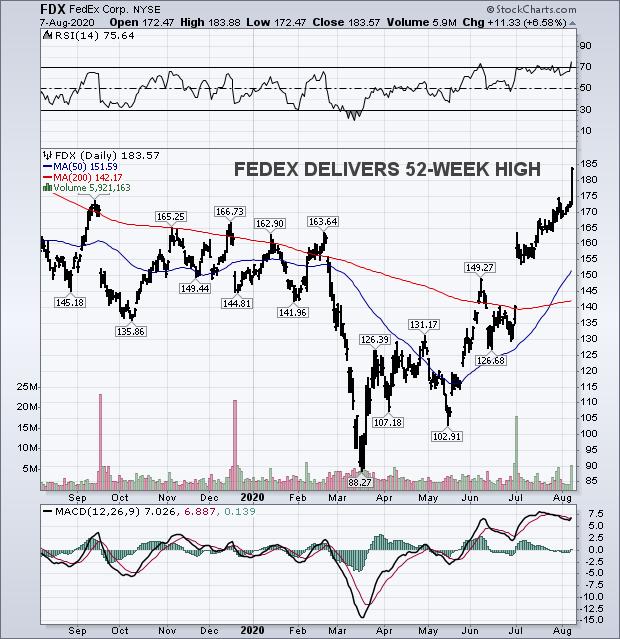 Chart 3
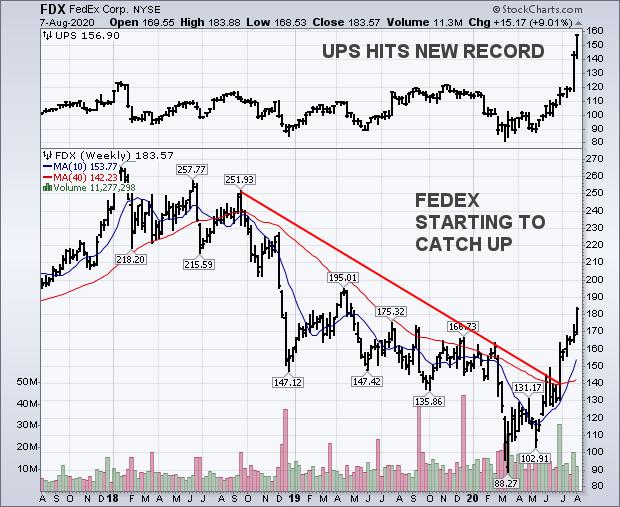 Chart 4
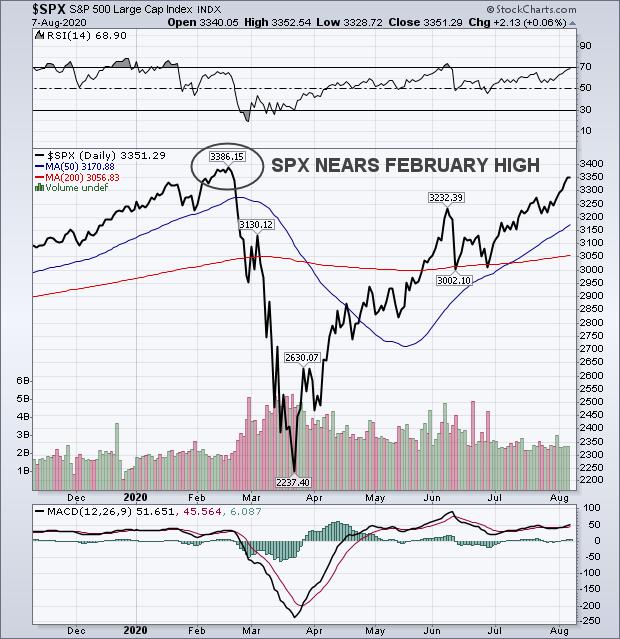 Chart 5
Editor's Note: This is an article that was originally published in John Murphy's Market Message on Friday, August 7th at 3:34pm ET.


