The daily bars in Chart 1 show the QQQ breaking last week's short-term support and falling further below its 50-day moving average today. The two upper boxes in Chart 1 also show its RSI and MACD lines continuing to decline. That suggests more selling to come. It now appears likely that the QQQ could drop to its next potential support level along its July lows. The green horizontal bars in Chart 1 show that the July lows near 250 coincide with a 38% Fibonacci retracement of its March/September rally.
Chart 2 shows the S&P 500 also falling below its 50-day average and last week's low. Lower prices appear likely there as well. The next level of potential support is its late July low near 3200. The Dow is holding up a little better but is likely to follow the QQQ and SPX lower.
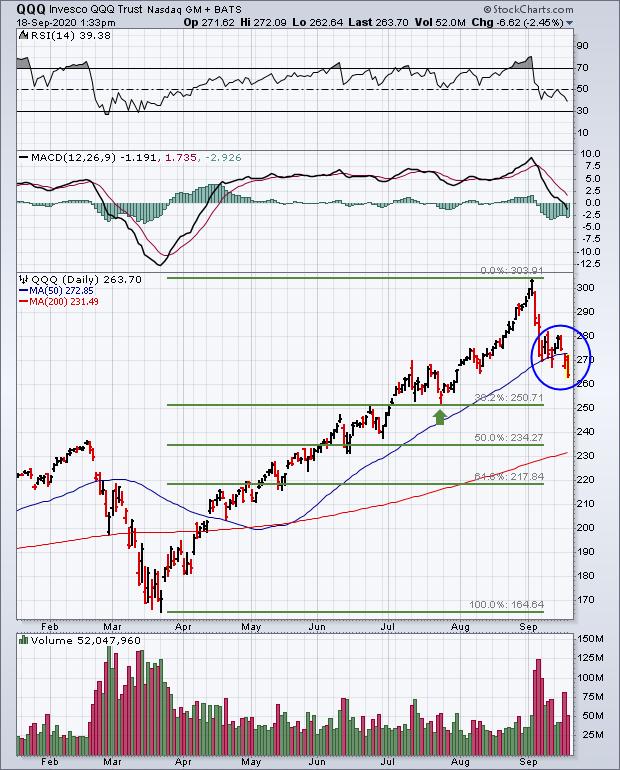 Chart 1
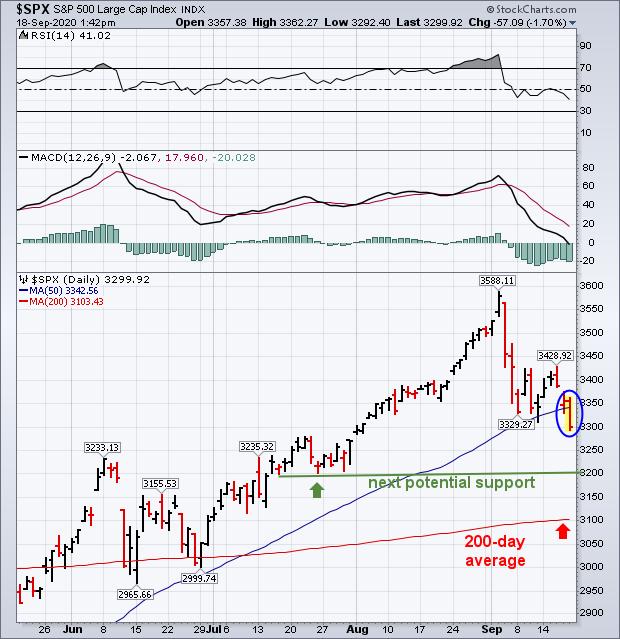 Chart 2
Editor's Note: This is an article that was originally published in John Murphy's Market Message on Friday, September 18th at 1:30pm ET.


