This morning's strong jobs report saw a bigger than expected jump in nonfarm payrolls during August and a bigger than expected drop in the unemployment report to 8.4%. That strong combination helped contribute to today's rebound in bond yields. Chart 1 shows the 10-Year Treasury yield rising 9 basis points today to 0.71%. The 30-year Treasury yield in up an even stronger 12 bps. That means that Treasury bond prices are dropping. That's unusual on a day when stocks are having another weak day. But not all stocks are being sold equally. The biggest losers are in technology, communications, and consumer discretionary which have been the most over-extended on the upside. Some stocks in the value category are holding up a bit better. That's especially true of financials which usually benefit from higher bond yields and a steeper yield curve.
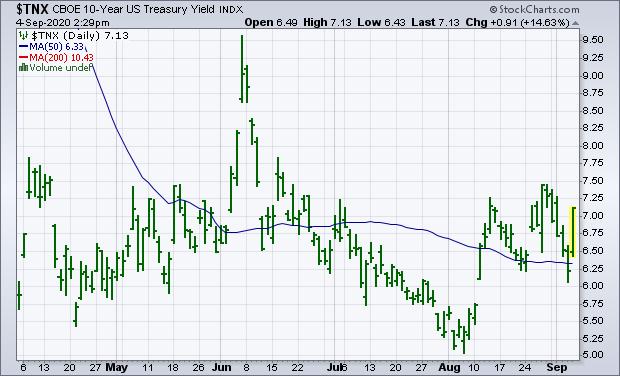 Chart 1
Most market sectors are in the red today. The only two in the black are financials and industrials. Part of that may be due to some money rotating out of over-extended megacap growth stocks like technology and into cheaper value stocks. Rising bond yields are another factor boosting financials, and banks in particular. Chart 2 shows the Financial Sector SPDR (XLF) trading modestly higher today and continuing to struggle with its 200-day moving average and resistance at its August high. The XLF needs a decisive close above both to signal higher prices. The XLF has been one of market's weakest sectors this year (-16%) and has remained an underachiever over the last month. That can be seen by the XLF/SPX ratio (solid gray line) which declined during August. But the ratio line has gotten a nice bounce over the last couple of days due to relative XLF stability in the face of a weaker stock market. And higher bond yields. Banks are also outperforming today.
Rate sensitive banks and life insurers are leading the XLF higher today. Chart 3 shows the KBW Bank Index ($BKX) trading higher today and continuing to find support along its 50-day moving average (blue line). The BKX, however, remains well below its 200-day average. The solid gray line shows the BKX/SPX relative strength ratio also bouncing over the last two days after a weak August. There again, some money leaving tech stocks may be moving into cheaper and more stable bank stocks. Banks also benefit from higher bond yields.
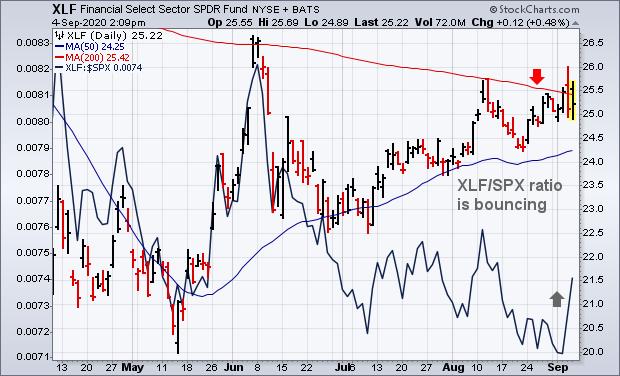 Chart 2
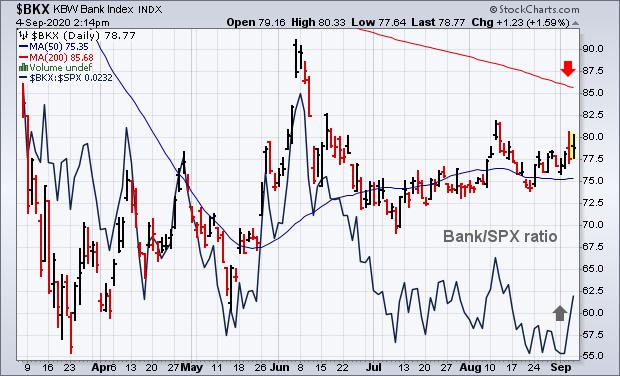 Chart 3
Editor's Note: This is an article that was originally published in John Murphy's Market Message on Friday, September 4th at 2:03pm ET.


