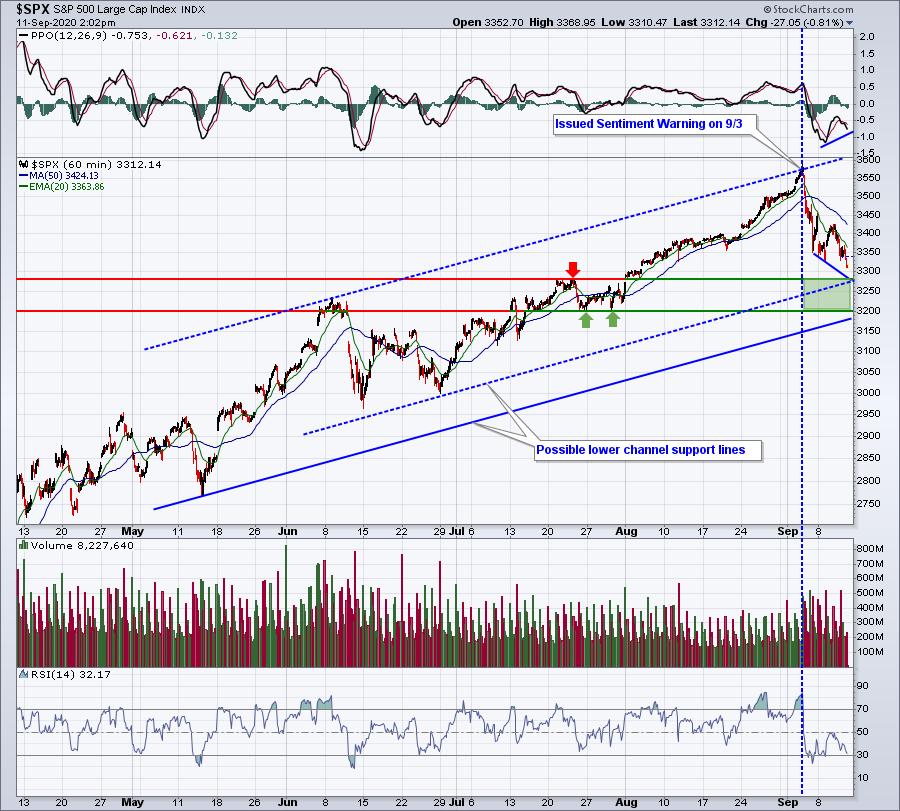
Despite remaining very bullish, I've written several short-term bearish articles lately, mostly dealing with extreme sentiment issues. Those sentiment extremes have been rectified and are no longer a problem, but they've now changed the mentality in the market from "buy on the dip" to "sell on the rebound." I believe that's rather pronounced when we look at a 60-minute chart:
I want to point out a few things on this chart:
(1) I posted a warning in my Trading Places blog on the morning of Thursday, September 3rd, titled "2 Sentiment Indicators Are Suggesting Extreme Caution - BEWARE!". This warning coincided with the blue-dotted vertical line in the chart above. You can see that the market immediately heeded that warning. It should be noted that this warning was coming from someone who remains steadfastly bullish, but please don't confuse a long-term secular bull market with a short-term sentiment warning. And remember one more thing: September is historically the worst calendar month of the year. It makes sense to be much more cautious this time of year.
(2) There's a 60-minute positive divergence in play. We could see a bit more short-term selling, but we're likely going to see a bounce next week - one that could take us back to 3400 or slightly above. I wouldn't be surprised, though, to see one more serious bout of selling to shake out more traders before the next pre-earnings rally. Based on the above chart, I'm looking for a September low somewhere in the 3200-3300 range.
(3) I like to draw channels. If we take the high from June and connect it to the high from a week ago, we get an upper channel line. To get a lower channel line, we simply drag that top line down to key price lows. The blue-dotted channel line connects the late-June low, while the solid channel line connects the May low. Look for a bounce off of one of these channel lines.
Downside Target Using 60-Minute Chart: 3200-3300
Next, I want to look at key Fibonacci retracement support levels. For this, I'll use the 6-month daily chart:
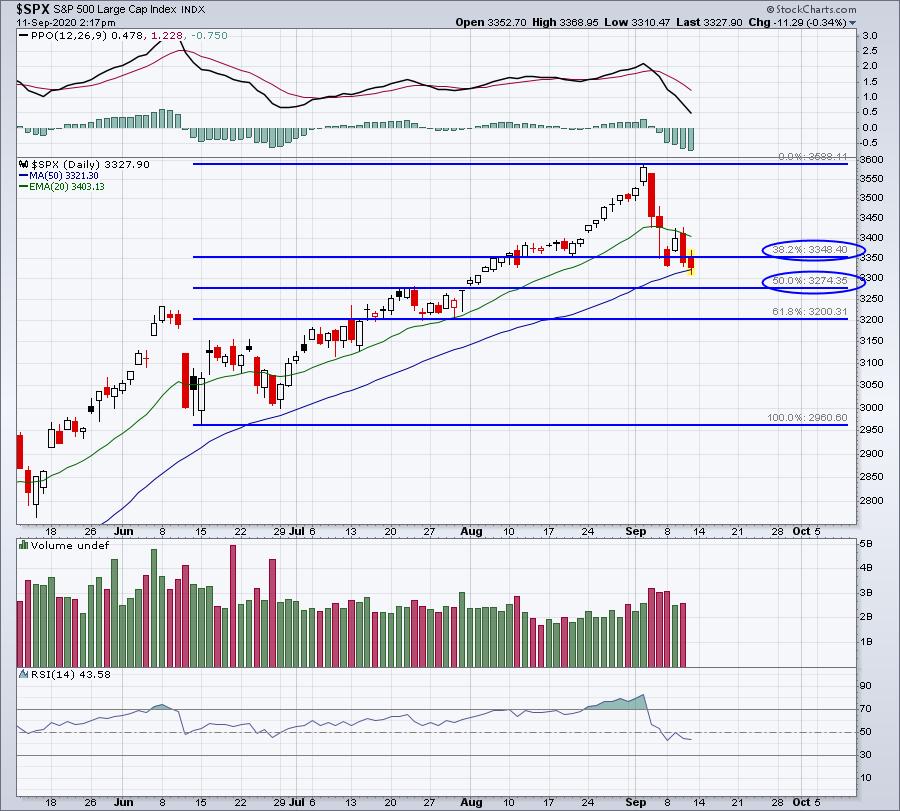
I believe the selling will end at either the 38.2% or 50.0% retracement levels. If we do see a bounce next week, that could set us up for one more decline to take us back down to roughly 3275.
Downside Target Using Fibonacci: 3275-3348
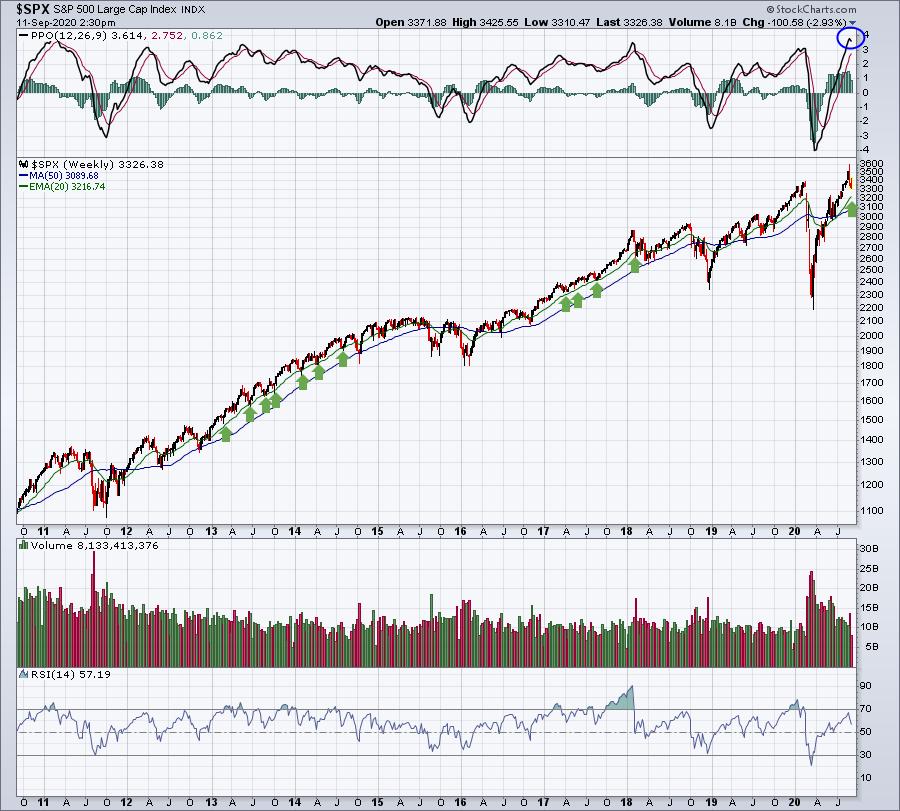
Finally, I think it's always prudent to review the long-term weekly charts. Sometimes, we get so caught up in the "here and now" that we lose sight of the Big Picture. So if we step back and view where we've been, it's a little easier to see where we might go:
There are a few points to be made here:
(1) For those of you that are bearish longer-term, there is a broadening top pattern in place (higher highs, lower lows). This pattern would confirm if that March low was breached. I do not expect that to happen, but I thought I'd mention the pattern.
(2) I'm calling a weekly PPO top. I believe the PPO has topped out. First of all, a weekly PPO rarely reaches 4 and it's easiest to do so after a long brutal selloff. The resulting rebound tends to be extremely quick and can produce a surge in the weekly PPO. 2009 was a perfect example. 2020 is another. While the PPO will likely decline from here, that simply means that the rate of acceleration in prices will likely slow. It doesn't mean we'll move lower. Any positive PPO is a good PPO; I simply wouldn't be expecting a 50% gain in the S&P 500 over the next 6 months like we've seen over the past 6 months.
(3) Watch the rising 20-week EMA. I believe we'll see action like we saw in 2013, 2014 and 2017. I look for a continuing uptrend with support at that long-term moving average.
Downside Target Using S&P 500 20 Week EMA: 3217
To conclude, I'm looking for a bit more selling here in September. While it's possible we quickly resume the uptrend we've enjoyed off the March lows, I think the odds are greater that we'll see another low in September to possibly test the rising 20-week EMA, then another pre-earnings advance.
I'll be keeping our EarningsBeats.com community updated as I see more data. If you'd like to join our community, please SIGN UP for our free EB Digest newsletter, published 3x per week on Mondays, Wednesdays and Fridays.
Happy trading!
Tom


