 Breadth indicators, such as Advance-Decline Percent, measure the participation behind a move in the underlying index. Sometimes participation is so strong that it tips the scales and signals the start of an extended move. For example, 10-day EMA of SPX AD% triggered a bearish breadth thrust on February 25th and the S&P 500 extended lower. Subsequently, a bullish breadth thrust triggered on April 29th and the advance extended into early September. Downside participation was quite strong the last two weeks, but not enough to tip the scales and trigger a bearish breadth thrust. Let's investigate.
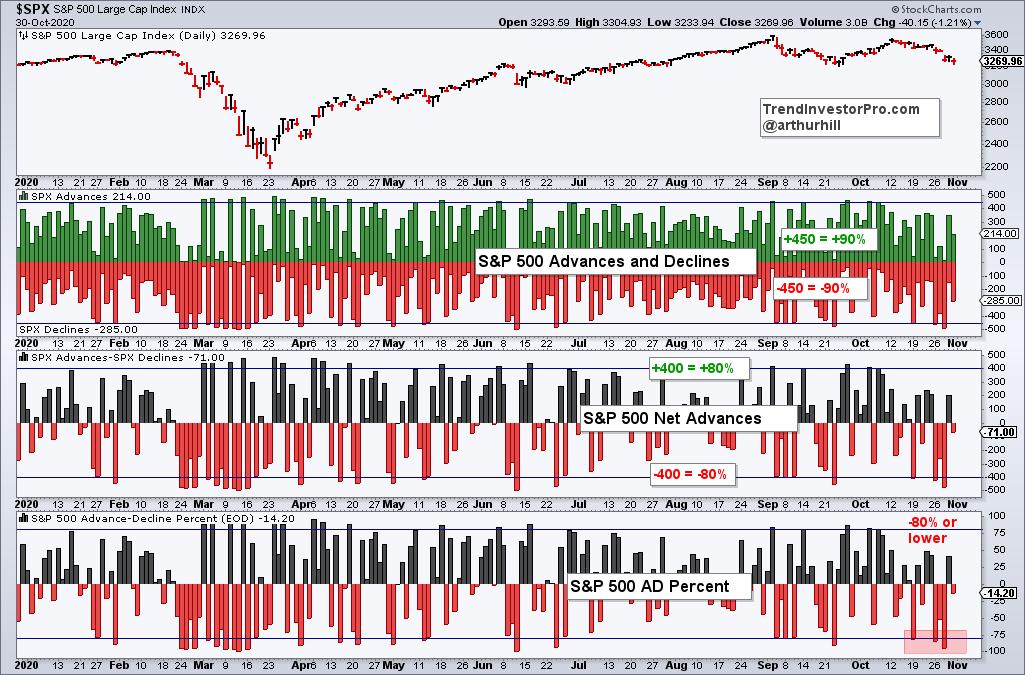
AD% measures the percentage of net advances in an index (advances less declines divided by total issues). The chart below shows an example using the S&P 500. AD% is -80% when there are 50 advances and 450 declines ((50 - 450) / 500). This means 90% (450) of stocks in the S&P 500 declined. As we can see with the red shading on the chart below, AD% dipped to -80% or lower three times in the last ten days. There were 214 advances and 285 declines on Friday so AD% equals -14.2%.
Daily AD% readings can be quite noisy with regular moves above +80% and below -80%. A string of such moves can provide a signal or we can apply a moving average for smoothing. The next chart shows a 10-day EMA of AD%, which I cribbed from Marty Zweig, who also used a 10-day EMA for his breadth thrust indicator. A move above +30% triggers a bullish breadth thrust, while a move below -30% triggers a bearish breadth thrust. As the chart below shows, there was a bearish thrust on February 25th and a bullish signal on April 29th.
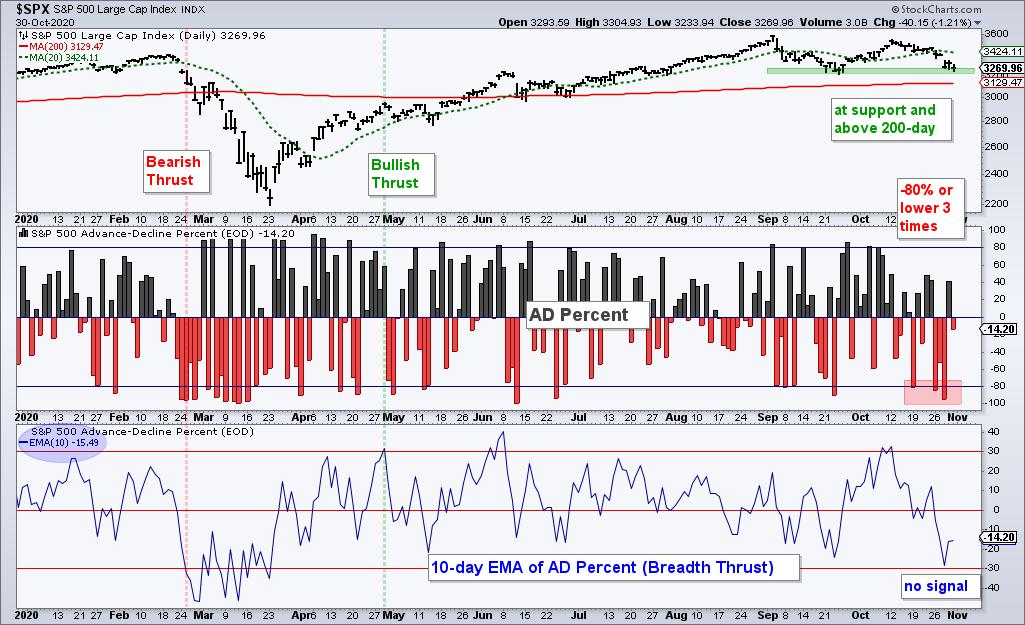
Even with the -14.2% reading on Friday, a bearish breadth thrust did not trigger because the 10-day EMA finished at -15.49% (see left side for value). This means the S&P 500 avoided a bearish breadth thrust, is above its 200-day, is short-term oversold and is trading near support from the September lows. Hmm...
You can find these indicators and dozens more on the Essential Breadth Indicator ChartList. This ChartList covers dozens of breadth indicators with over 100 custom charts. It is organized in a logical top-down format to streamline the analysis process. This list is available to subscribers at TrendInvestorPro.com.
Click here to take your analysis process to the next level!
----------------------------------------------------
Choose a Strategy, Develop a Plan and Follow a Process
Arthur Hill, CMT
Chief Technical Strategist, TrendInvestorPro.com
Author, Define the Trend and Trade the Trend
Want to stay up to date with Arthur's latest market insights?
– Follow @ArthurHill on Twitter


