These are the ten stocks in the S&P 500 with the highest market capitalization, and they will have a significant effect on the movement of that market index. A quick review will show that they are all going through a topping process, which could prove to be an important turning point - or just a "pause to refresh." It is certainly good reason to stay alert and see how the process resolves on each one.
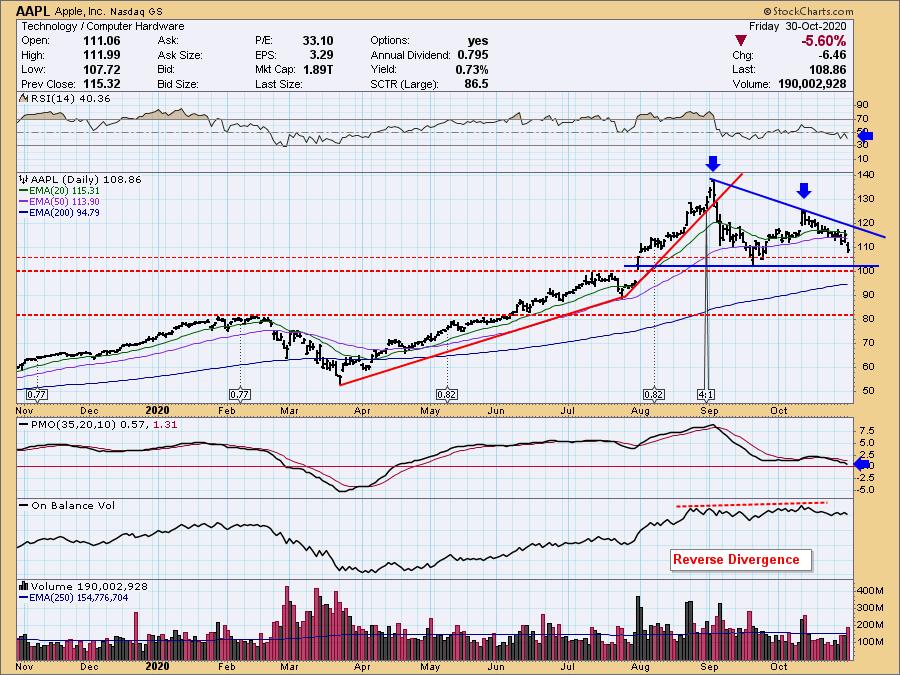
Apple (AAPL)
The biggest of the big, AAPL, influences the movement of the markets. For this reason, it's important to know its chart. Like the major markets, Apple is sporting what could be considered a double-top, but I also see another bearish formation, a descending triangle. Regardless of which it is, the minimum downside target remains the same at a conservative $85-$90. Additionally, there is a reverse divergence between price and the OBV. Note that OBV tops rose slightly, but price tops did not. Despite the influx of positive volume, price wasn't able to even challenge that September top. You can see the 4:1 split annotated. Carl pointed out on the DecisionPoint Show just prior to that split that typically you will see a decline after the split - and here we are.

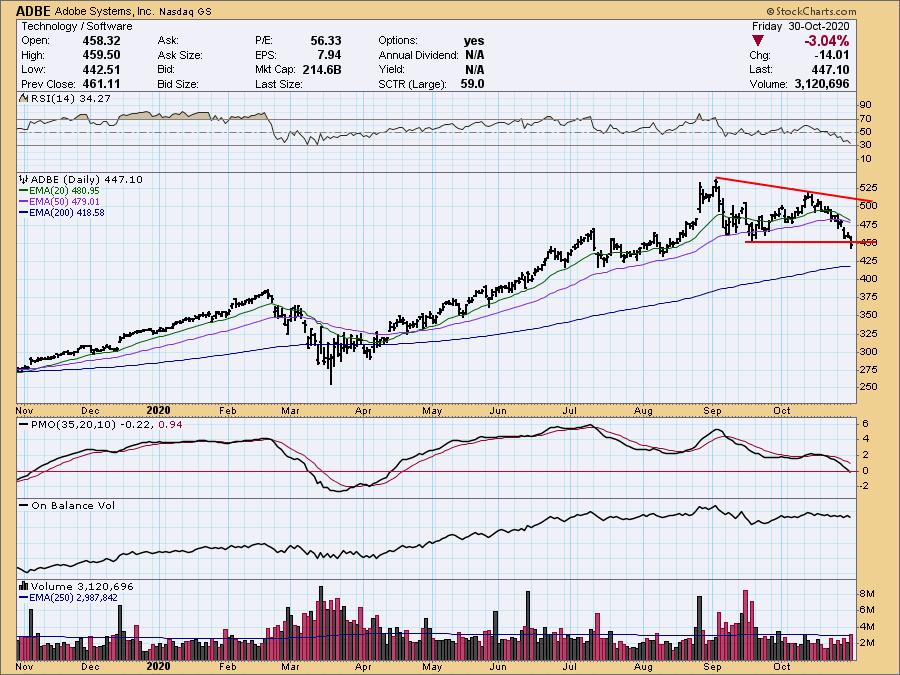
Adobe Systems, Inc. (ADBE)
Price has now broken support at the September bottom and has already breached both the 20/50-EMAs. The 200-EMA could possible hold as support, but we have a PMO that is now below the zero line and a very negative RSI.
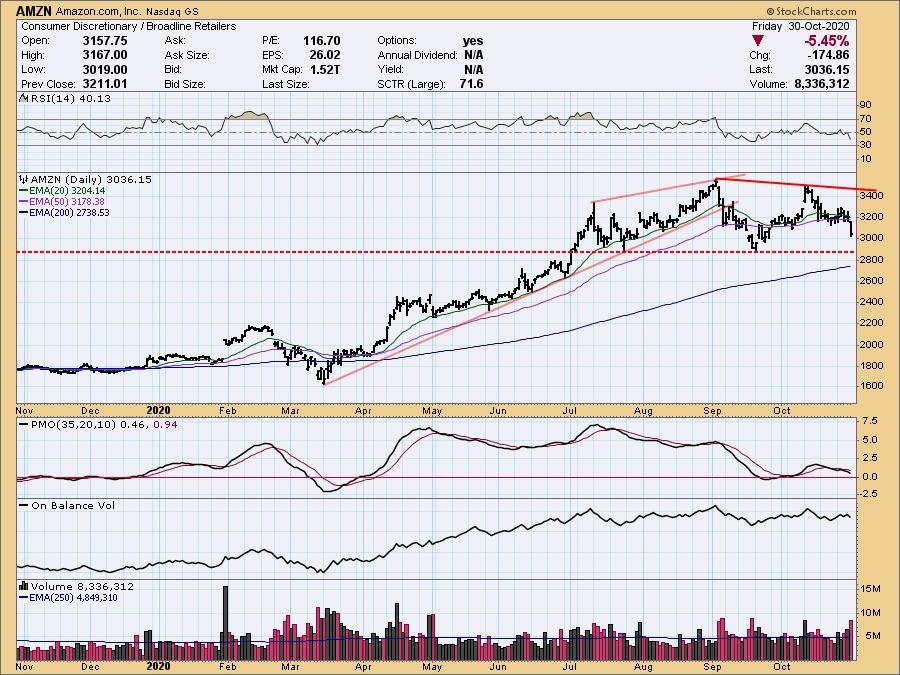
Amazon.com, Inc. (AMZN)
We have a double-top on AMZN, a PMO SELL signal and a negative RSI. Today, a decisive breakdown below the 20-/50-EMAs occurred. Support is nearing, but that is also the confirmation line for the bearish double-top.
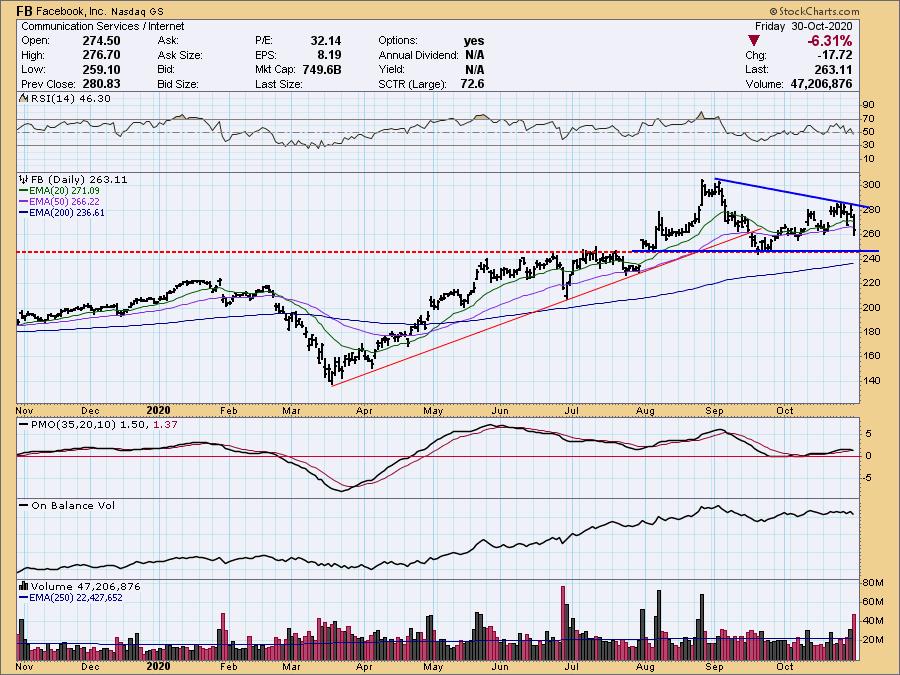
Facebook, Inc. (FB)
Here we have another descending triangle. The PMO has turned down, but is still above the zero line. The RSI is mostly neutral.
 Click here to register in advance for the recurring free DecisionPoint Trading Room! Recordings are available!
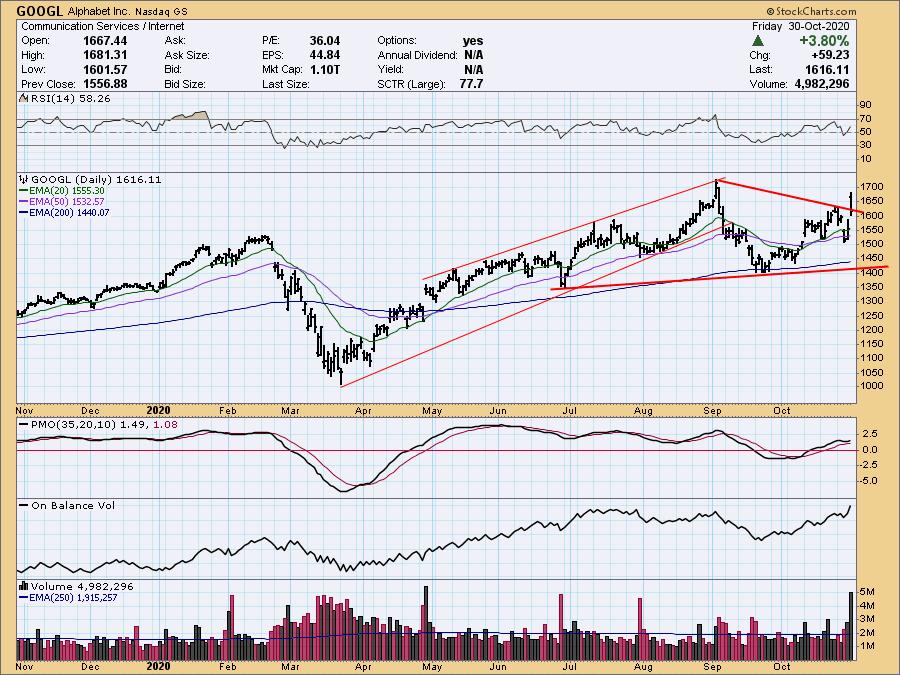
Alphabet (GOOGL)
This is the only stock in this group with a positive move on Friday, but notice that is closed at the low end of the daily range and didn't actually clear the declining tops line.
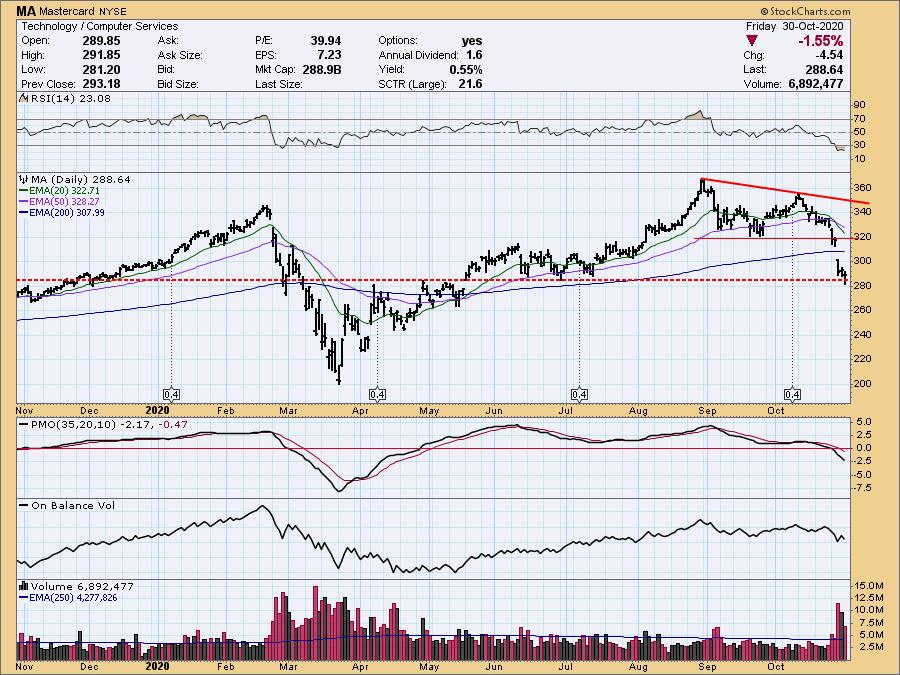
Mastercard (MA)
Mastercard has a very oversold RSI, which is generally a positive; however, we note that oversold conditions can persist in a bear market environment like March.
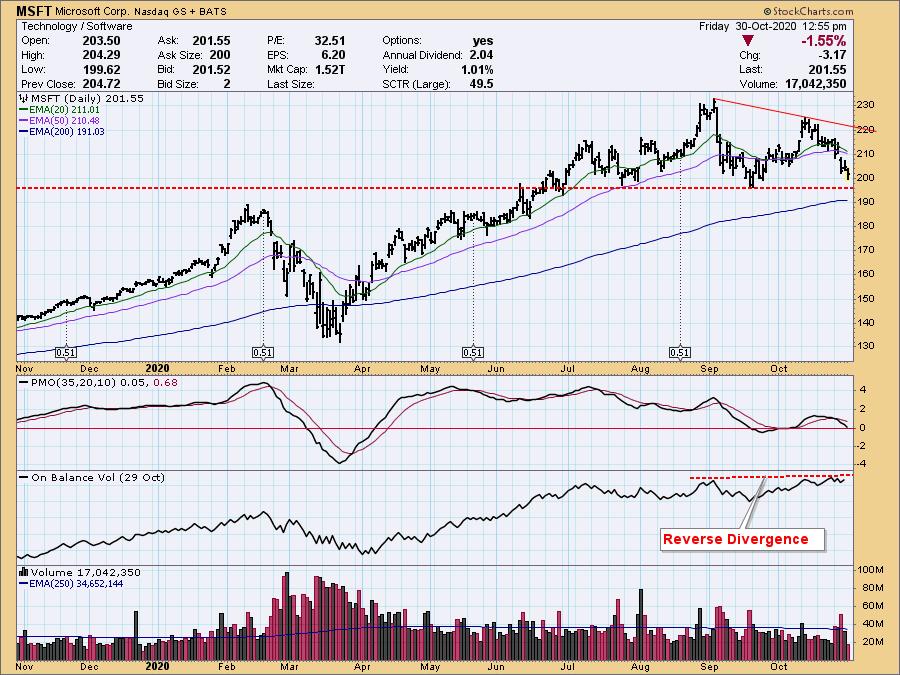
Microsoft Corp (MSFT)
Another double-top, with price readying to test support at the confirmation line and the 200-EMA. We have a reverse divergence as OBV tops are rising as price tops are declining.
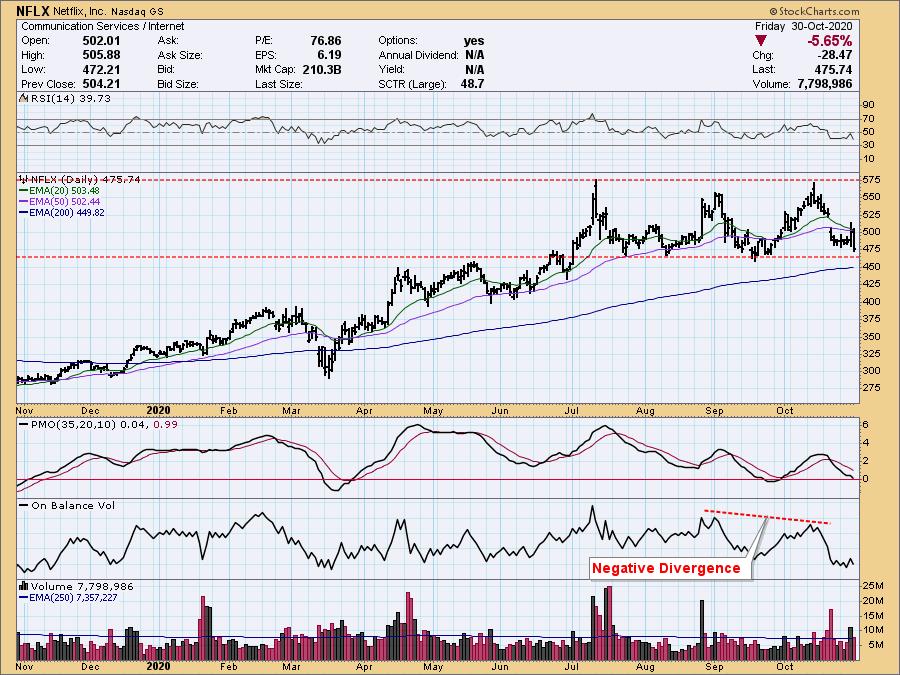
Netflix Inc (NFLX)
NFLX is in a trading range. The PMO is oversold, but the RSI is negative and not quite oversold. There is a negative divergence with the OBV. This support level needs to hold; otherwise, we should expect a difficult decline.
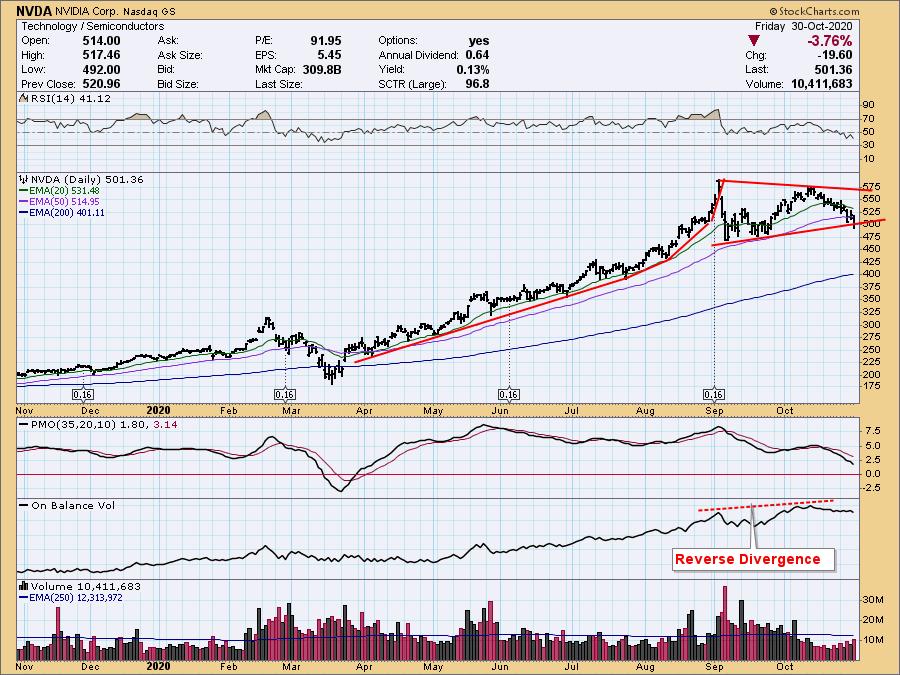
NVIDIA Corp. (NVDA)
We have a symmetrical triangle on NVDA and price is trying to break down. These are typically continuation patterns, so we would expect an upside breakout. A bearish conclusion to a bullish pattern is typically especially bearish. We also have another reverse divergence. You'll note that, after the split in September, price declined and is currently trading lower.
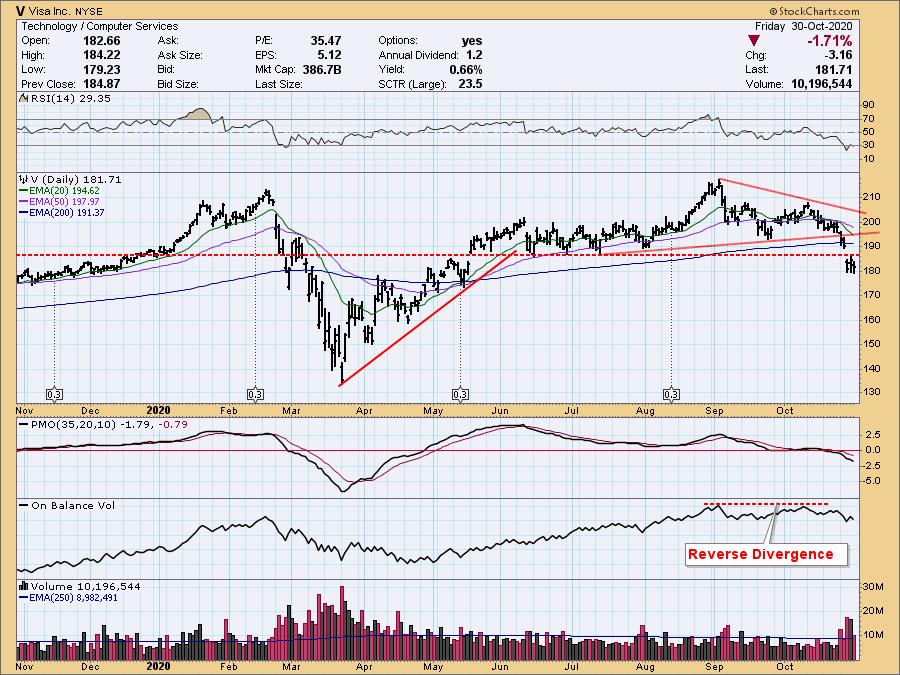
Visa Inc (V)
The RSI is oversold, but we can see it maintain that condition in a bear market or correction. We could be looking at an island reversal, but, given the falling PMO, the breakdown below the 200-EMA and other support levels, I would expect more downside for Visa.
Conclusion: These stocks will move the markets due to their large capitalization. It's important we have a grasp on what these charts display. Given the majority are in the process of topping and testing meaningful support levels, we should prepare for further weakness in the market going into the end of the year.
Happy Charting!
- Erin Swenlin, VP, DecisionPoint.com
Technical Analysis is a windsock, not a crystal ball.
Helpful DecisionPoint Links:
DecisionPoint Alert Chart List
DecisionPoint Golden Cross/Silver Cross Index Chart List
DecisionPoint Sector Chart List
Price Momentum Oscillator (PMO)
Swenlin Trading Oscillators (STO-B and STO-V)


