Sometimes, it's a good idea to approach likely market action not so much from an analysis of the market itself, but substituting intermarket or inter-asset relationships to accomplish the same objective. It is a fact that each business cycle goes through a set series of chronological sequences. We know this best from the publication of leading coincident and lagging indicators, which get their name from the fact that certain areas of the economy, such as housing starts, lead us out of recession, while others, such as capital spending, prosper in the more mature phase of the recovery. The great thing about all this is that the primary trend turning points for bonds, stocks and commodities are part of this chronological sequence. Specifically, stocks respond to swings in the economy about 90% of the time. Two notable exceptions developed in 1926-27, when a major sell-off was avoided despite a recession. The second was in November 2001, when prices continued to drop for 11 months following end of that recession. Monitoring the 12-month MA would have kept you in stocks in 1927 and out of them in the 2001-02 period.
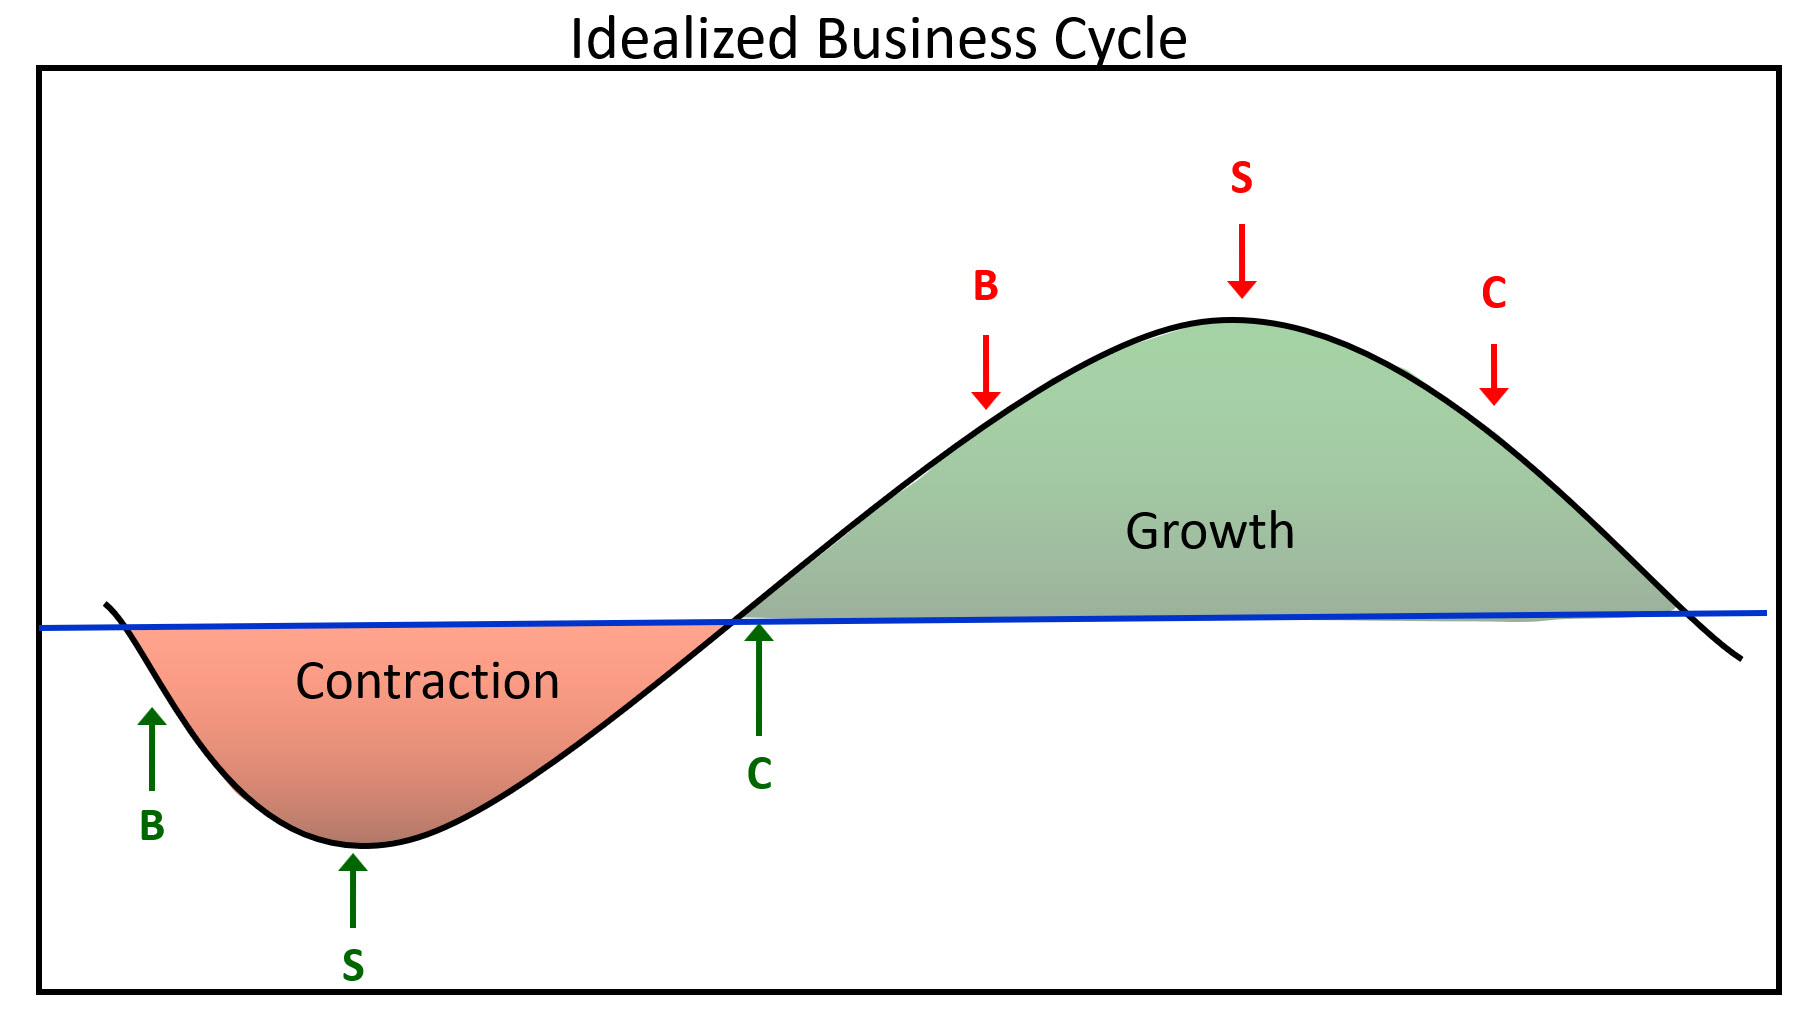 Figure 1
Figure 1 shows an idealized economic growth path, with the theoretical peaks and troughs of the financial markets. Bonds usually bottom after the recession has gotten underway. Stocks reach their low point later, as market participants begin to realize that higher bond prices (lower yields) are going to have a positive effect on the economy.
In that respect, Chart 1 compares the performance between stocks and bonds. It shows that, in reality, the nice-looking connection between them in Figure 1 is not always helpful. Yes, bonds do have a tendency to lead stocks at major tops and bottoms, but the leads and lags vary. Also, the 2009 stock market bottom was accompanied by a bond market peak.
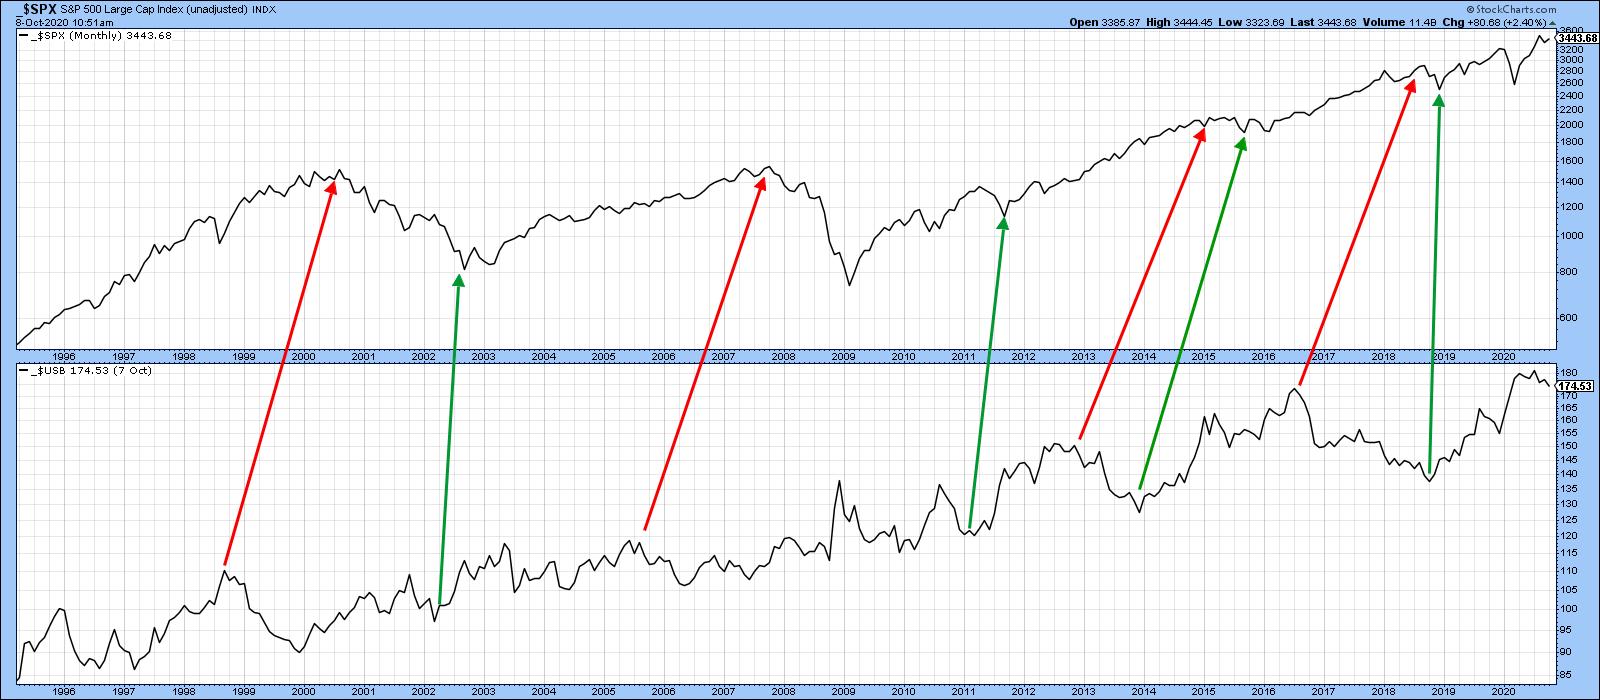 Chart 1
Chart 2 takes us a step further by comparing stocks to the ratio between stocks and bonds. This arrangement, whilst not perfect, does offer a more cyclic feel akin to Figure 1. It may be informative using the benefit of hindsight, but, from a practical point of view, this relationship is not offering much in the way of actionable signals going forwards.
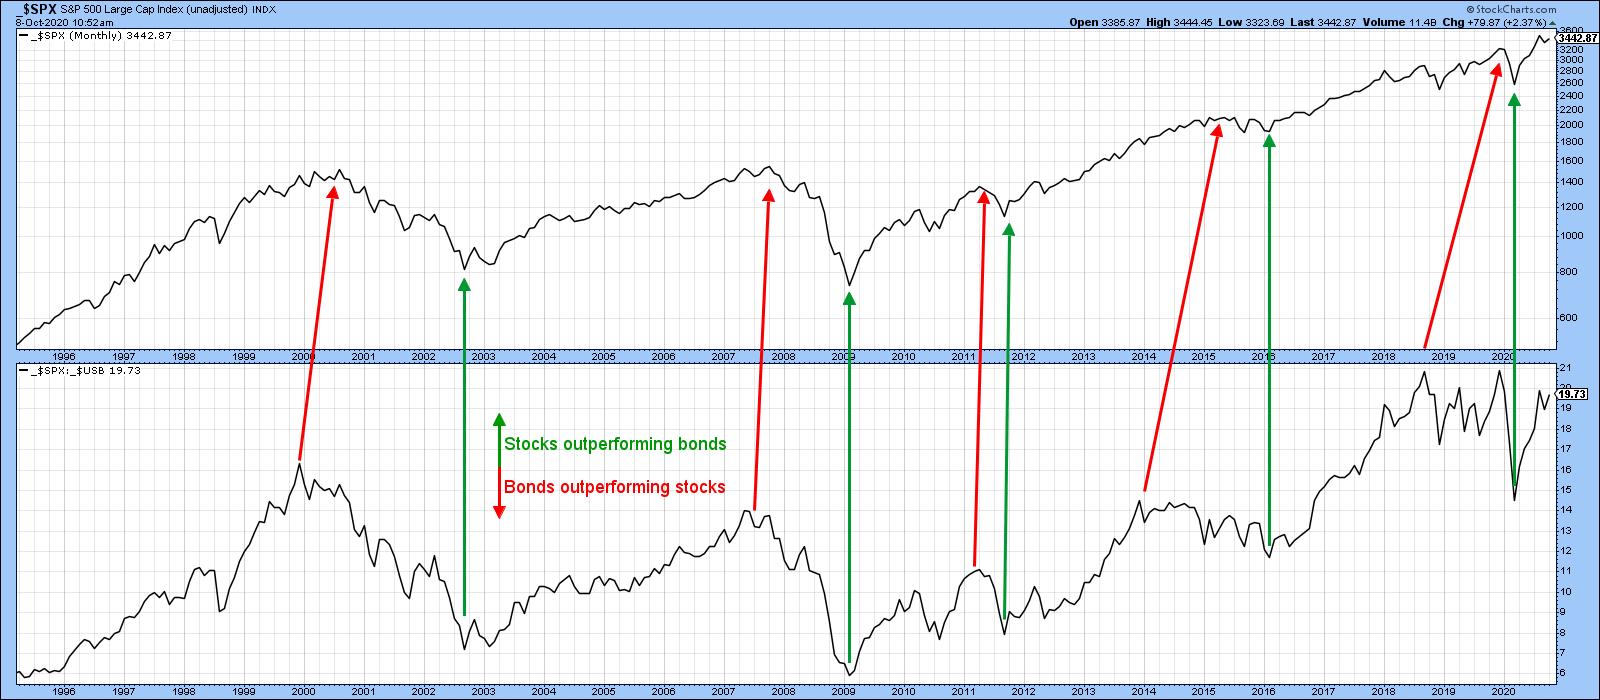 Chart 2
That's where Chart 3 comes in, as it's possible to construct a series of trendlines for both the S&P and the ratio. Violations are typically followed by an important change in the direction of the stock market. Note that the last few years have been periods of consolidation for the ratio. That suggests that, if it can break above the horizontal green resistance trendline, a long-term durable rally will follow for both series.
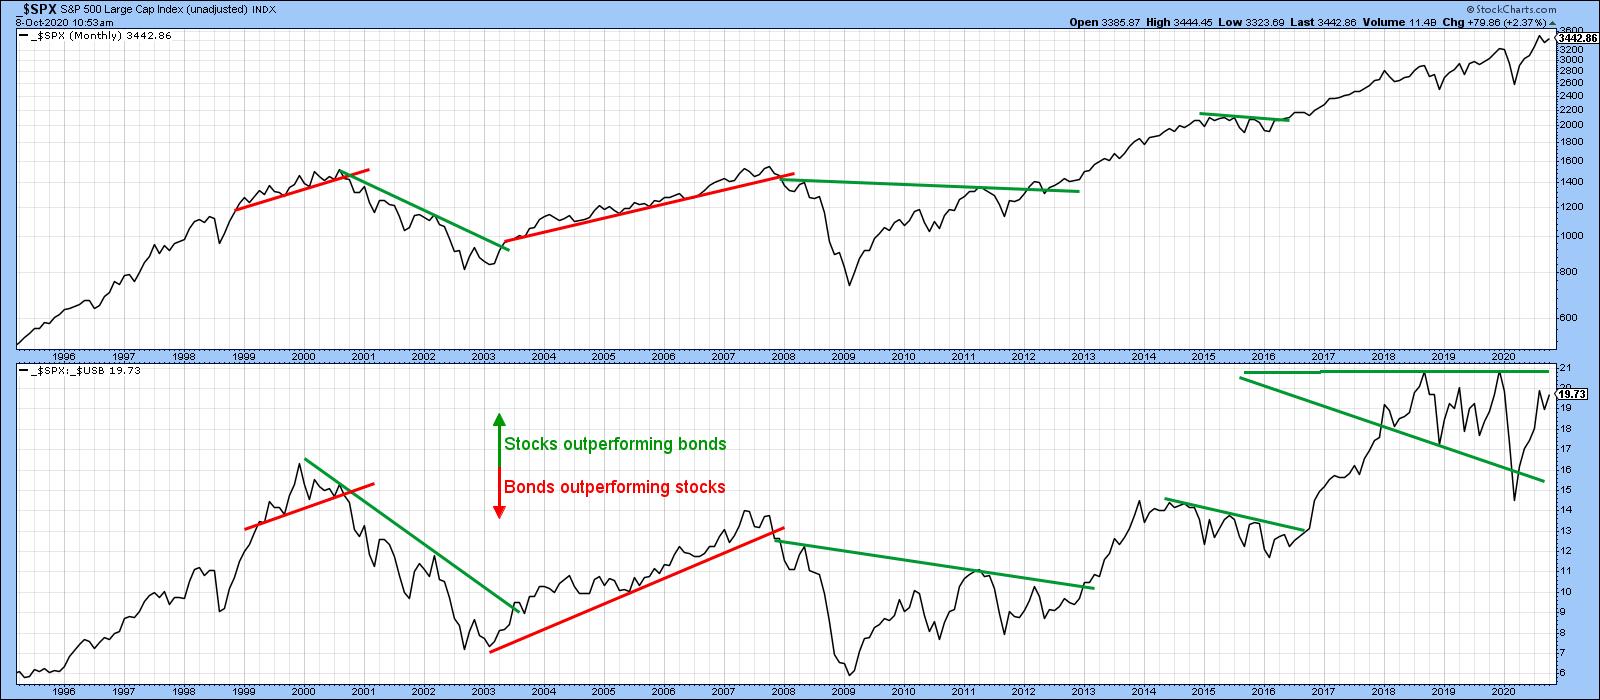 Chart 3
A more objective and arguably reliable approach is to calculate a long-term momentum curve for the ratio, such as the KST. Chart 4 shows that positive MA crossovers by this highly cyclic indicator are then used as buy signals for the stock market. The chart tells us that all six previous signals were followed by a long-term equity rally. In that respect, the thick arrows point up cycles that experienced a recession, whereas the thin ones reflect four slowdowns in the growth rate of the economy. Slowdowns occur where the economy's growth rate decelerates, but not sufficiently to result in a recession. Note that the two recession associated signals were followed by the longest and strongest advances.
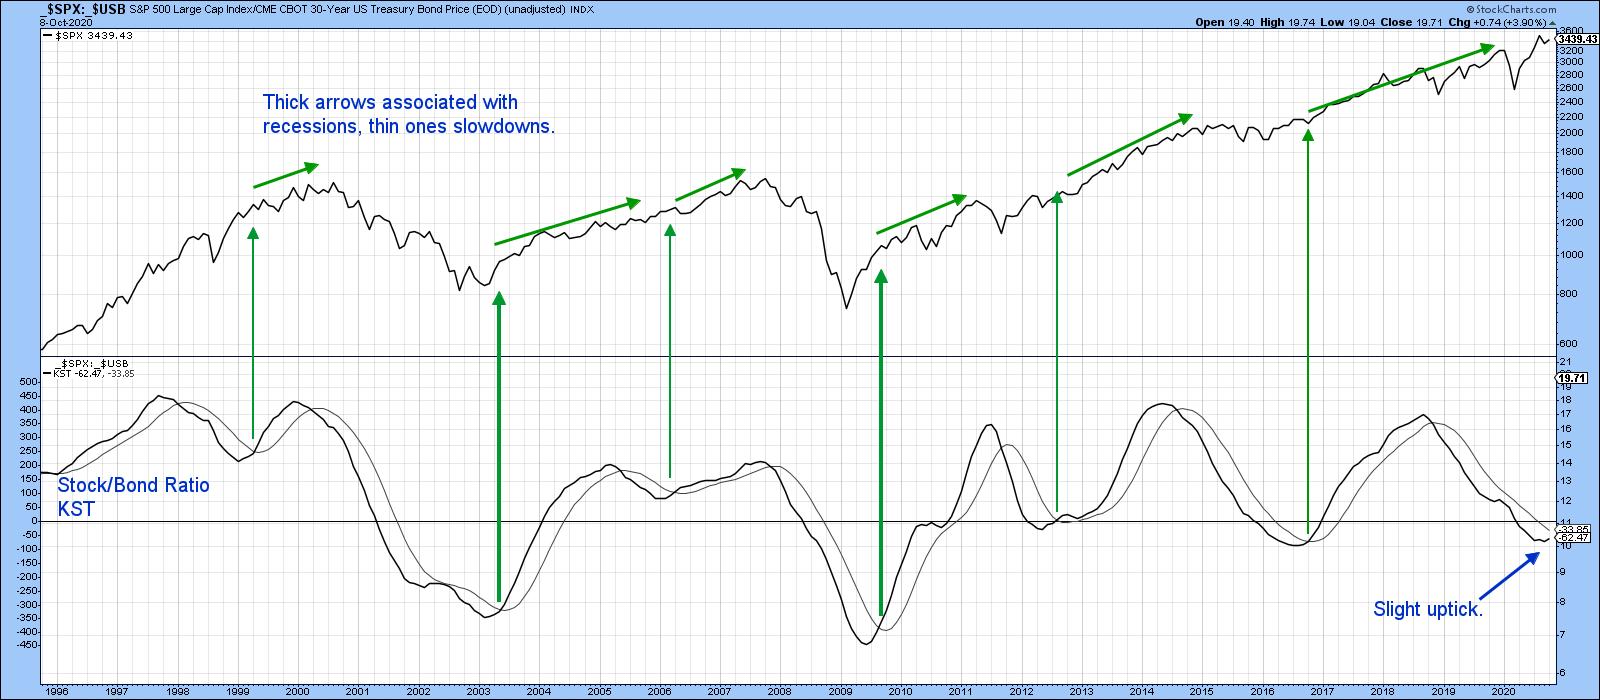 Chart 4
The KST has yet to experience its 2020 recession-associated buy signal, but the latest uptick suggests that it may not be that far away.
Remember, you can update these charts going forward by simply clicking on them.
Editor's Note: This is an excerpt of an article originally published in Martin Pring's Market Roundup on Thursday, October 8th at 1:27pm ET. Click here to read the full article, which includes charts 5-7 and further analysis using Pring's Special K indicator and the 12-day ROC.
Good luck and good charting,
Martin J. Pring
The views expressed in this article are those of the author and do not necessarily reflect the position or opinion of Pring Turner Capital Group of Walnut Creek or its affiliates.


