I remain firmly in the secular bull market theory camp. We're going higher. Forget about politics, civil unrest, the virus, the deficit, the economy, blah, blah, blah. Money flow, the Fed and historically-low interest rates will fuel higher prices. While each of those is extremely important in the performance of U.S. equities, here are the 3 really big reasons why I believe stocks are heading higher.
Seasonality
I've done quite a bit of historical analysis over the years, and there are clear identifiable patterns as to how the stock market trades. Let's start with a simple seasonality chart of the S&P 500 over the past 20 years:
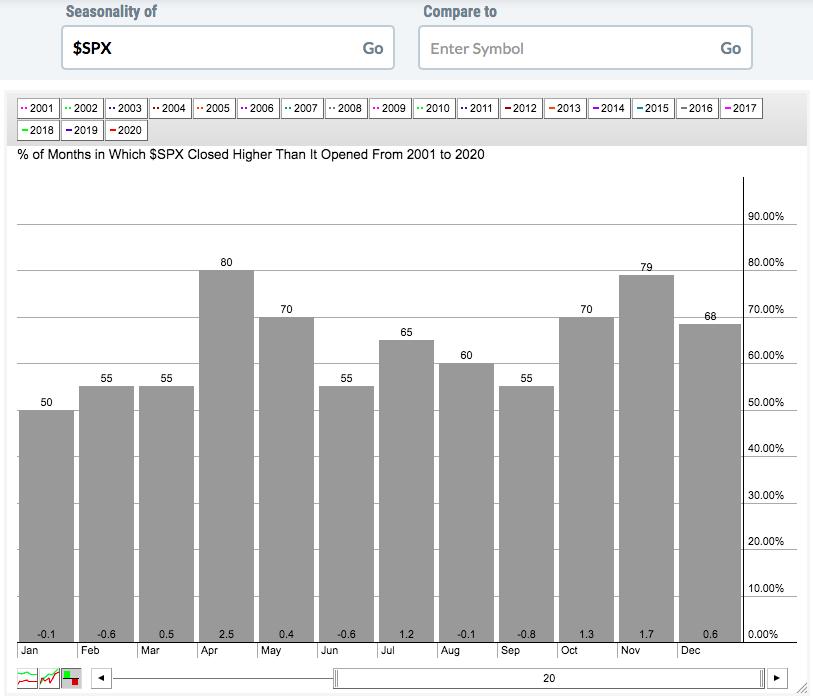
April has been the strongest month this century, rising 80% of the time AND producing average monthly gains of 2.5%. The second- and third-best months are November (rises 79% of the time, with average monthly gains of 1.7%) and October (rises 70% of the time, with average monthly gains of 1.3%), respectively. In fact, if we look at the S&P 500, there have only been 7 years when this benchmark index has fallen during both October AND November. Here are the years:
1951, 1971, 1973, 1976, 1987, 2000, 2008.
5 of those 7 years occurred during the secular bear markets from the 1970s and 2000s. 1987 was when we had Black Monday and the resulting fallout the next month (November). Outside of those years, we've had ONE year since 1950 when we've been in a secular bull market and saw the S&P 500 slide during both October and November in the same year. I think it's safe to say that the odds really favor the bulls during the balance of 2020.
Let's take it one step further. If we look at the S&P 500 from the close on October 27th through the close on January 18th of the following calendar year, our benchmark index has ended this period higher than it started in 61 of the last 70 years. It's risen 35 times in the past 38 years during that period. I'd say the odds are definitely on the bulls' side. But it's not just the frequency of the gains, it's the size of them. Before I give you this next stat, keep in mind that the S&P 500 has averaged gaining roughly 9% per year since 1950. Would you like to know how many times the S&P 500 has gained at least 9% during this "less-than-90-day-period"? 17. And if we lower the bar to 8% or more, the number swells to 25 times in the past 70 years.
What if I said that the NASDAQ's history during this period is even more bullish? Because it is. The average gain on the S&P 500 during that October 28th through January 18th period is 4.59%. The NASDAQ? +6.20%. Furthermore, over the past three decades, here are the 4 best calendar months on the NASDAQ in terms of annualized returns:
November: +23.42%
October: +22.02%
December: +22.01%
January: +21.25%
The rest of the year? +7.18%
We're into the second week of October and we see the stock market gaining strength. It's just beginning.
Transportation Stocks
The history of the stock market tells us that, when the Dow Jones Transportation Average ($TRAN) breaks out, it's generally a very good thing for the overall stock market. It's very difficult to argue with this if you've looked at a long-term weekly chart and transports' correlation with the broader market:
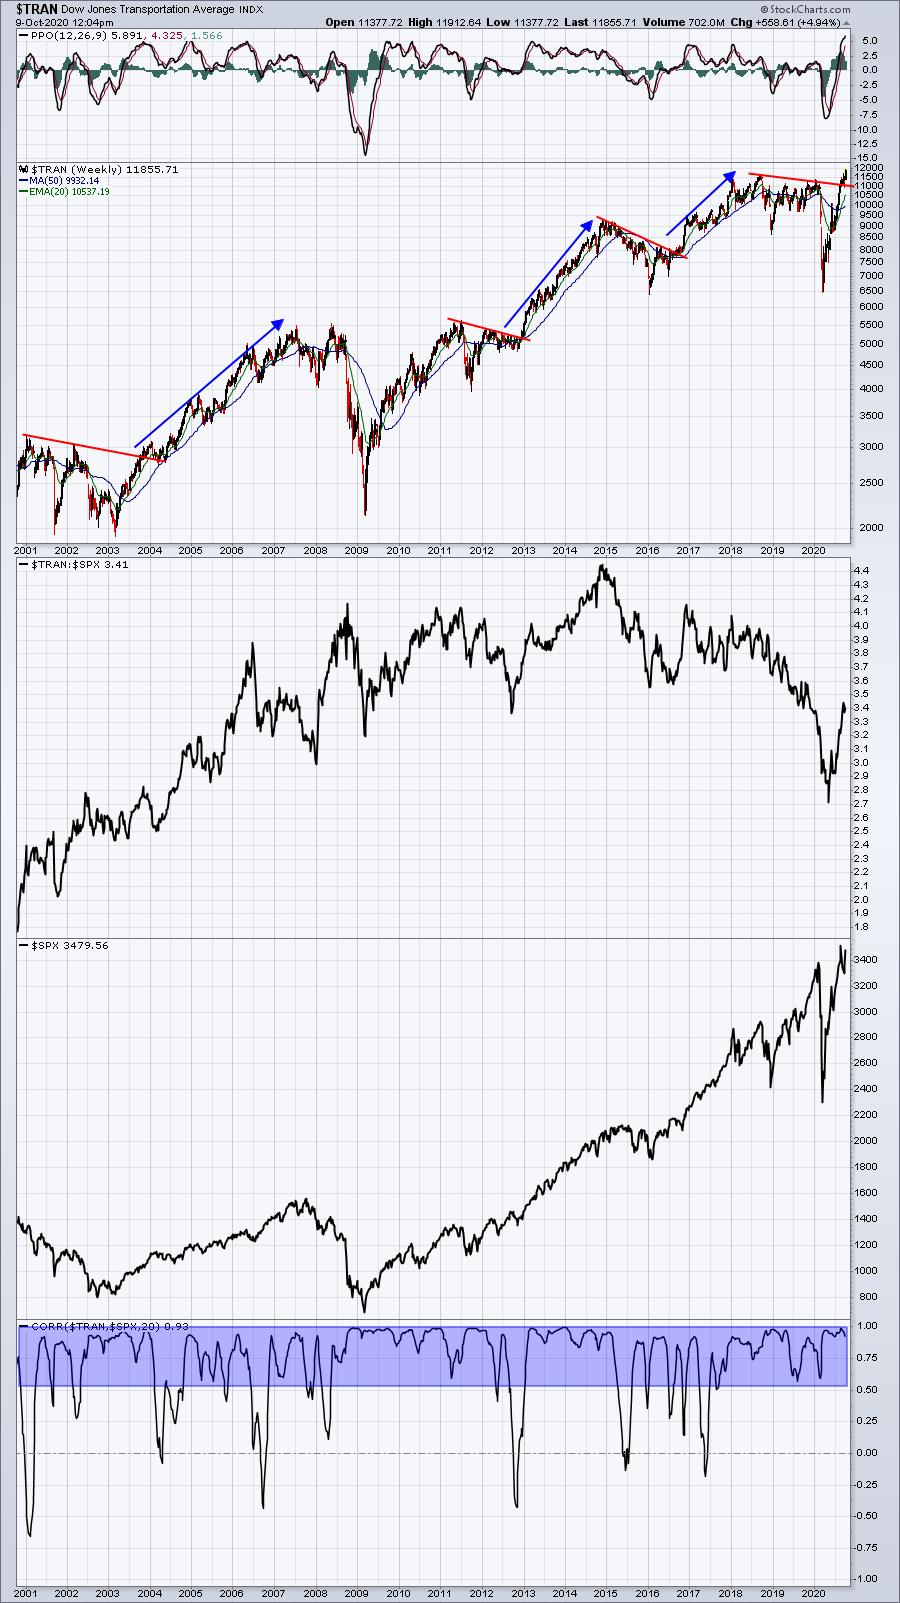
When transports struggle, it's typically associated with uncertainty in our economy and a consolidating (or selling) S&P 500. But when this group ends its consolidation and resumes its uptrend, it sends a very bullish message to investors/traders. We're getting that message right now.
10-Year Treasury Yield ($TNX)
When I've been asked in recent months what could possibly carry the stock market higher, I've responded nearly every time with this: ROTATION. It's that simple. As transports send us the signal of a strengthening economy ahead, bond traders will sell bonds and move to stocks to capture the better performance during economic expansion. We begin to see big Wall Street firms announcing their rotation to a more aggressive allocation between stocks and bonds. Of course, they're not going to tell you before they do it. Instead, the rotation will take place on the charts, and then the news will follow.
So how can we tell that money is rotating? Follow the 10-year treasury yield ($TNX). In addition to the strong correlation between transports and the S&P 500, there's a very similar positive correlation between the TNX and the SPX:
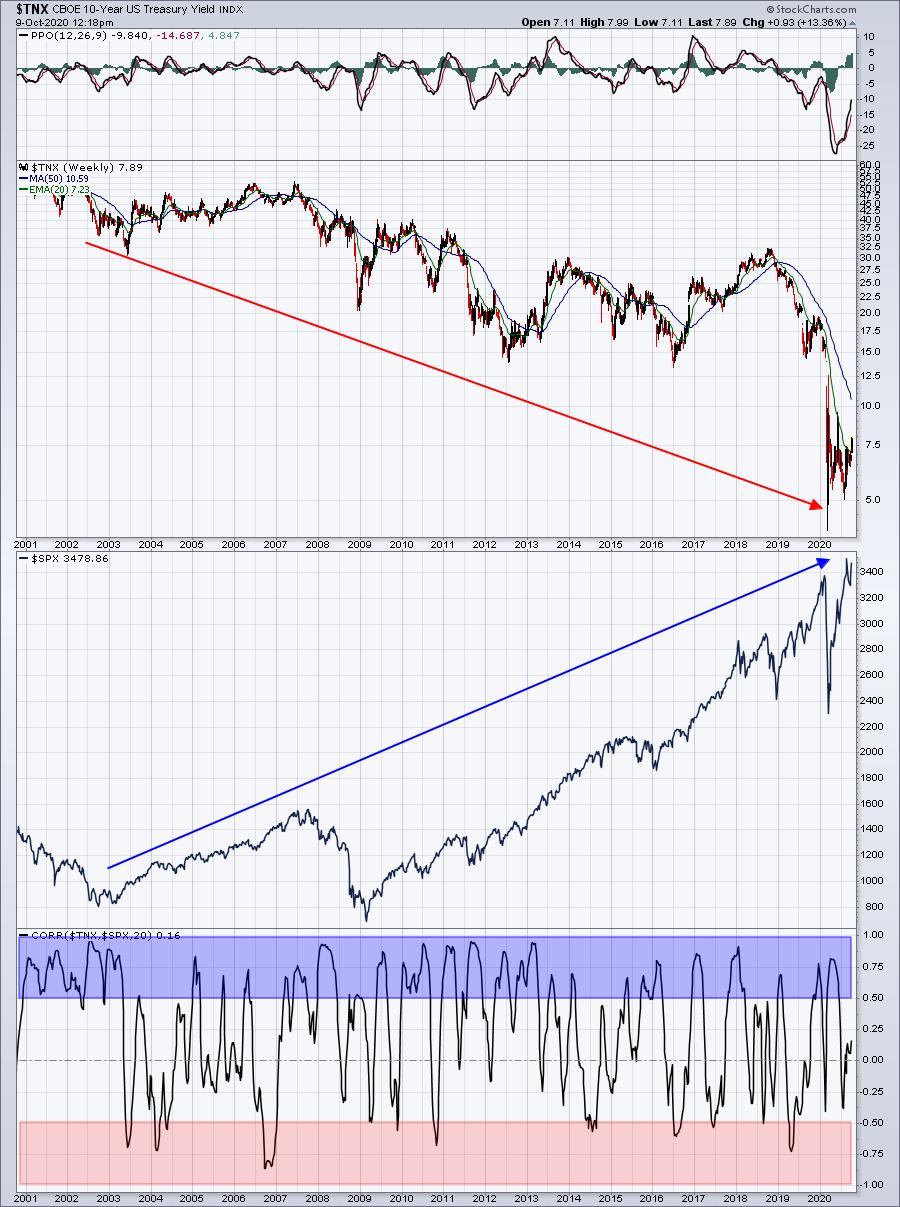
At first, it may appear that your eyes are deceiving you. The TNX has been in a downtrend for 20 years. The S&P 500 has been mostly in an uptrend for 20 years. Therefore, the initial conclusion would probably be that there's inverse, or negative, correlation between the two. But look at the shaded areas. There's much more positive correlation (blue-shaded area) than negative correlation (red-shaded area). The correlation is based on a 20-week period, not 20 years. When treasury yields rise, money is leaving the bond market. During secular equity bull market advances, that money pours into stocks. That's what we have on our hands now - a secular bull market. If you don't believe me, then objectively answer this question: How could the S&P 500 set new all-time highs after a trade-war-related cyclical bear market (Q4 2018) AND a 100-year-pandemic-related cyclical bear market? Seriously, can there be news much worse that what we've dealt with the past 2 years? Sure, we took a hit each time, but we came roaring back - very unlike 2007-2009, when every rebound was met with another serious drop.
We're in a different market environment. I've been writing about it all year. Stop fighting this bull market. I'm not talking about an advance that lasts the rest of this year....or for 2021. I'm talking about a secular bull market that will last another 10-12 years, into the 2030s.
It's CHECKMATE!
If you'd like to take advantage of the incredible strength we're going to see the next several years, join me and Grayson Roze, VP of Operations at StockCharts.com. We have a TON lined up for a 2-hour event that starts at 11:00am ET on Saturday, October 10th, including (1) Grayson's overview of StockCharts.com's new ACP - their advanced charting platform, (2) my overview of our EarningsBeats.com research engine (I'll show you how simple it is to set up our research in YOUR StockCharts.com account in minutes!), (3) mine and Grayson's top 5 stocks for Q4, plus much, much more!
If you recall, Grayson and I provided our top 5 picks back on April 1st during the height of the pandemic. My 5 were PTON, REGN, ZM, PETS, and WING. Grayson's were TEAM, FIVN, MSFT, AMZN, SHOP. PTON was a 5-bagger in 6 months. ZM was more than a 3-bagger. SHOP was close to a 3-bagger. Want our latest picks? Register NOW by CLICKING HERE and entering your name and email address at the bottom of the page!
If you want, you can join us using the room link below, but understand that you'll be added to our FREE EB Digest newsletter, published 3x per week. There's no credit card required and you may unsubscribe at any time. If you agree to be added, then click on this room link Saturday morning any time after 10:30am ET. The webinar will begin promptly at 11:00am ET. https://us02web.zoom.us/j/87945264831
Happy trading!
Tom


