We have all heard that "a rising tide raises all boats," and at DecisionPoint.com we have come to think of the direction of the market tide as being a bias that can benefit or work against our trading positions. As regular market participants, we may have a general sense that the market has a bullish or bearish bias; however, it would be useful to have objective ways to assess that bias. This is something we evaluate on a daily basis in the DecisionPoint Alert, and here are some of the tools we use.
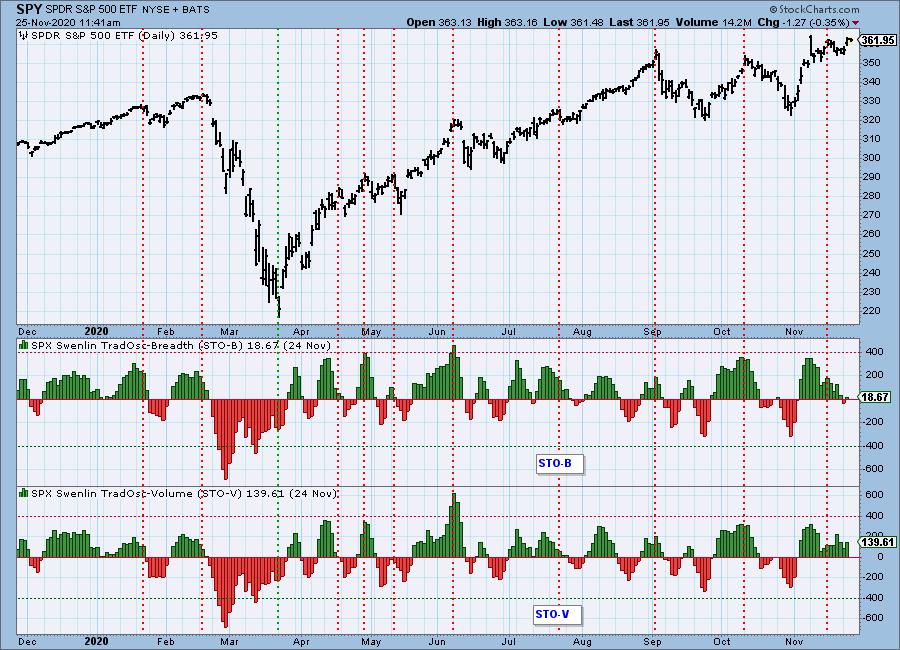
For the short term, we use the Swenlin Trading Oscillators for breadth (STO-B) and volume (STO-V). The normal range for both indicators is +400 to -400, and, on the one-year chart, we first assess how they are situated within that range. During the bear market earlier this year, a bearish bias was clear, as the STOs quickly plunged well below that normal range and stayed below zero until shortly after the March low. After that low, a bullish bias quickly became evident as the indicator ranges shifted to mostly above the zero line, and the time spent above the zero line far exceeded that spent below the zero line.
Beginning in September, the STO ranges began to shift to a more neutral stance as the moves below zero became deeper. Nevertheless, the time spent below zero was still less than that spent above, so the bias was still bullish.

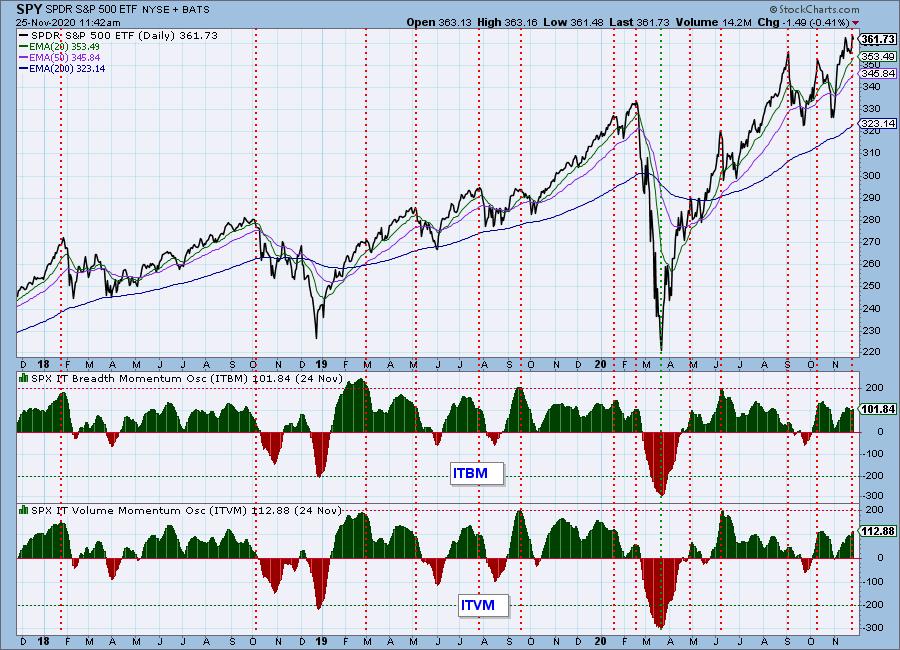
For longer-term assessment of market bias, we use the Intermediate-Term Breadth and Volume Momentum Oscillators (ITBM and ITVM). Using the same methodology as on the short-term chart, we can see that bias has been persistently bullish for the last three years, with the two bear markets, of course, offering splashes of bearishness. The question arises: is this the normal posture for these indicators?

Click here to register in advance for the recurring free DecisionPoint Trading Room! Recordings are available!
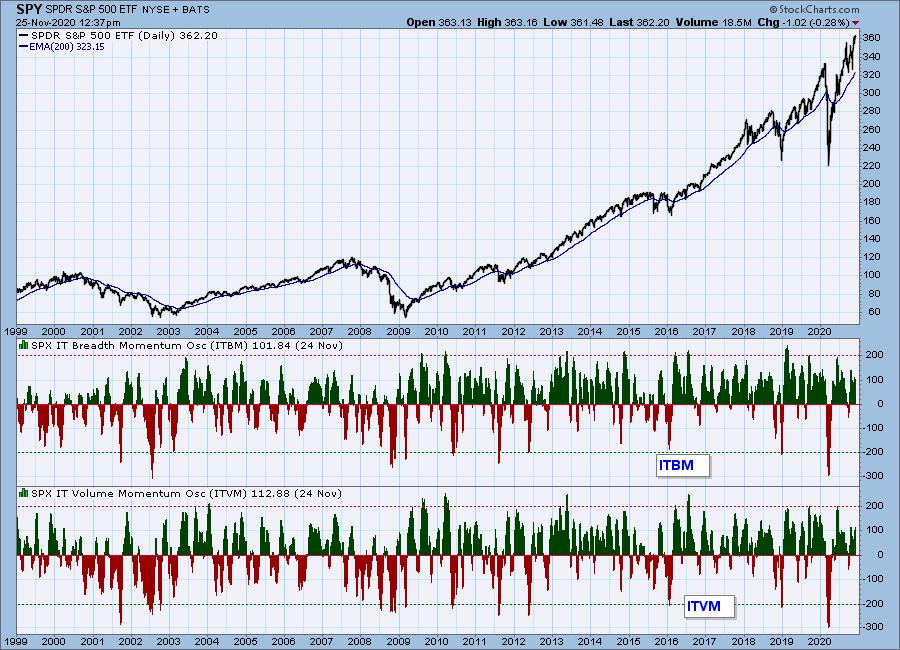
Looking at a 22-year chart, we can see that the indicators have favored a bullish bias since the 2009 bear market low. However, from 1999 to 2007, a neutral to bearish bias was more the norm.
CONCLUSION: Assessing market bias can help us make trading decisions that are compatible with the changing tide of the market. Our DecisionPoint indicators can provide objective evidence for making these decisions.
Technical Analysis is a windsock, not a crystal ball.
Helpful DecisionPoint Links:
DecisionPoint Alert Chart List
DecisionPoint Golden Cross/Silver Cross Index Chart List
DecisionPoint Sector Chart List
Price Momentum Oscillator (PMO)
Swenlin Trading Oscillators (STO-B and STO-V)


