 Boring and lagging ETFs turned into exciting leaders in November as we saw breakouts in the Regional Bank ETF (KRE) and REIT ETF (IYR). The breakouts are bullish and IYR has a short-term bullish continuation pattern working, but we should not forget about the prior leaders and ETFs with real growth prospects. Today we will cover KRE, IYR and a classic bullish continuation pattern in two tech ETFs.
The first chart shows The Regional Bank ETF peaking just below its falling 200-day in June, forming a long falling wedge and breaking out with a 50+ percent advance the last nine weeks. It is an impressive advance that is clearly bullish, but as MC Hammer would say: Can't Touch This!
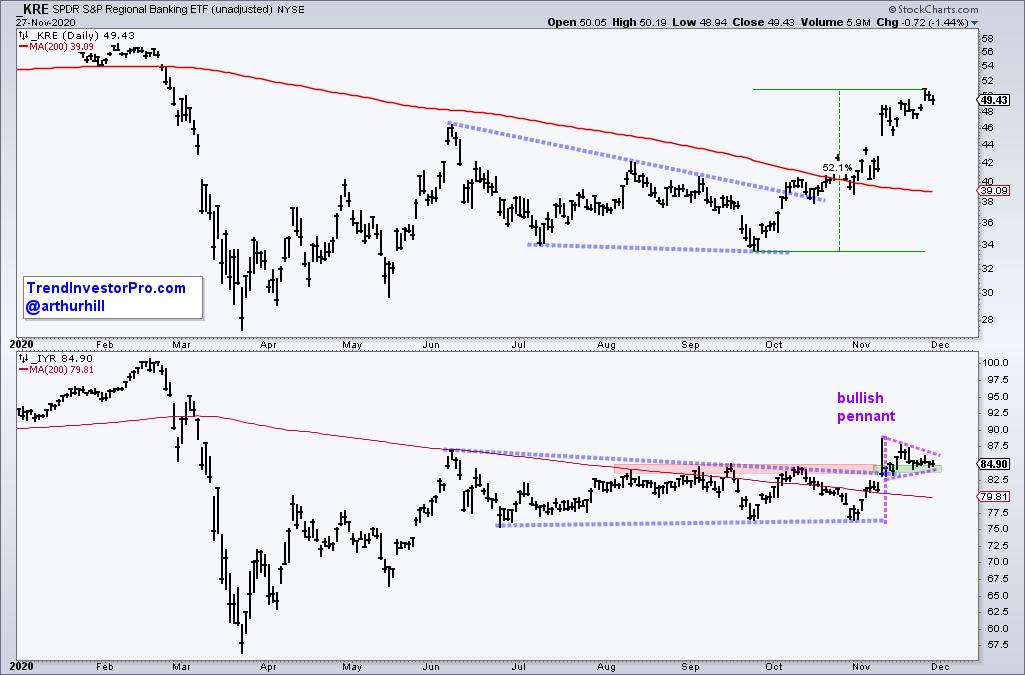
The bottom window shows the REIT ETF with a playable setup. The ETF broke out of a long triangle in mid November and the breakout zone turned into support. IYR consolidated the last two weeks and a pennant is taking shape. These are short-term bullish continuation patterns and a breakout at 87 would signal a continuation higher.
Even though banks, energy and other groups captured the market's attention in November, I would not dismiss the prior leaders. Sorry, but I do not see secular growth happening for old school banks, REITs and fossil fuels. Furthermore, we should be interested in an ETF or stock when trading has turned boring and volatility is low, not when excitement and volatility are high.
Note that Cyber Monday is this Monday, November 30th, and StockCharts is offering their biggest deal of the year: Get Four Months Free! Click here for details.
The next charts show the Software ETF and Internet ETF hitting 52-week highs in early September and then moving into the boring camp as both traded sideways. Even though they are not leading on the three month timeframe, they are leading on the nine to twelve month timeframes. In fact, note that KRE and IYR are still down year-to-date, and FDN hit a new high this week.
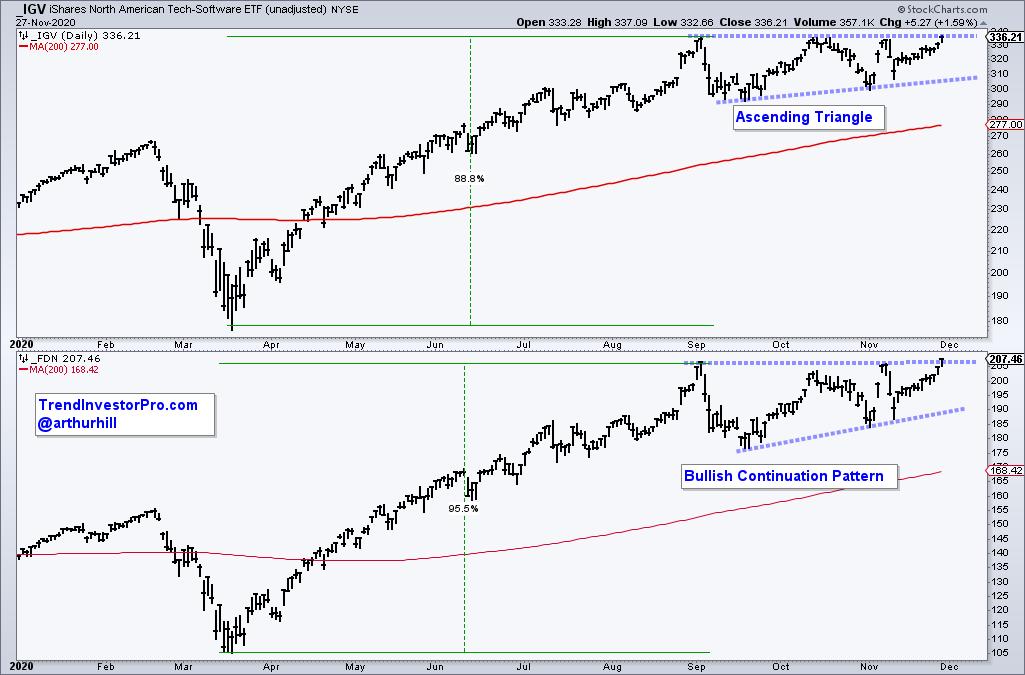
After a massive advance from late March to early September, IGV and FDN were entitled to a rest. The consolidation over the last three months provided the pause that refreshes and allowed the ETFs to digest their big gains. Moreover, both formed a classic bullish continuation pattern: Ascending Triangle. Breakouts would confirm these patterns and signal a continuation of their existing uptrends.
Looking for more trend analysis and bullish setups for ETF? TrendInvestorPro offers a comprehensive pattern and setup report with annotated charts as well as a ranking report that tracks trend and mean-reversion signals for over 100 ETFs. Click here to take your analysis to the next level!
-------------------------------------------
Choose a Strategy, Develop a Plan and Follow a Process
Arthur Hill, CMT
Chief Technical Strategist, TrendInvestorPro.com
Author, Define the Trend and Trade the Trend
Want to stay up to date with Arthur's latest market insights?
– Follow @ArthurHill on Twitter
