The U.S. dollar continues to weaken against both developed and emerging market currencies. Chart 1 shows the Invesco Dollar Bullish Fund (UUP) nearing a test of its yearly low. A drop below that level would put the dollar at the lowest level since early 2018. One of the factors pushing the dollar lower is stronger stock prices. That's because stocks and the dollar have been trending in opposite directions since the spring. The chart shows the dollar surging during the spring (as stock prices were falling); and then peaking in late March (when stocks bottomed). The dollar has been falling since then as stocks have continued to rally. That's because the dollar is usually viewed as a global safe haven. As such, it often attracts money when stocks are under pressure; and weakens when stocks rise. This week's sharp global rally has pushed the dollar into a test of its 2020 low.
One of the most obvious implications of a falling dollar is that it usually boosts commodity prices, and precious metals in particular. Yesterday's message showed gold and its miners starting to rise this week as the dollar weakened. A weaker dollar has also boosted industrial metals like copper and stocks that produce them. My message from October 21 covered that inverse relationship between the dollar and metal markets; and also pointed out that a falling dollar is usually bullish for emerging markets which were nearing an upside breakout. That breakout in emerging markets has now taken place.
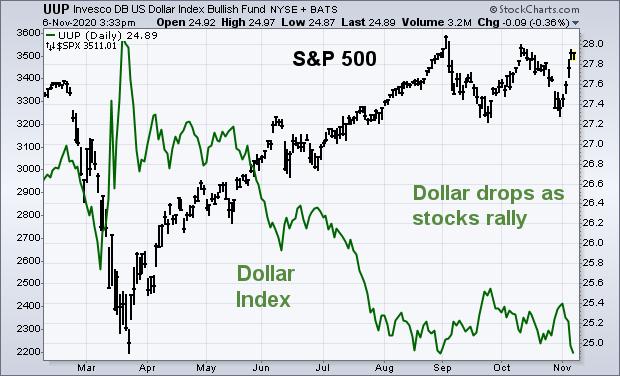 Chart 1The weekly bars in Chart 2 show the MSCI Emerging Markets iShares (EEM) breaking through their early 2020 high to reach the highest level since early 2018. That's a bullish breakout. The October 21 message also pointed out that EM markets were being led higher by stocks in Asia, and China in particular. Stock ETFs in China, South Korea, and Taiwan have all achieved upside breakouts. At the same time, the Chinese yuan has risen to a multi-year high against the dollar and has led a rally in emerging market currencies in general. That's another reason why a weaker dollar favors emerging markets.
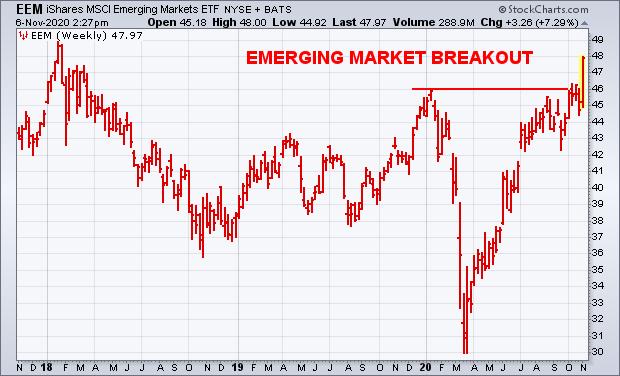 Chart 2
Chart 3 shows a generally inverse relationship between emerging markets and the dollar over the last four years. The falling dollar during 2017 coincided with rising EM markets; while a dollar bottom in early 2018 coincided with an EM peak (see arrows). The dollar spiked this spring while EM markets plunged. The falling dollar since the spring has coincided with strong emerging markets which are still rising. The EEM has just achieved a bullish breakout while the dollar is threatening its 2020 lows. One reason for their generally inverse relationship is that a falling dollar supports a more risk-on attitude for global stocks. A weaker dollar also supports emerging markets which generally carry a lot of dollar-denominated debt. A falling dollar makes it easier for them to finance that debt. So do rising emerging currencies.
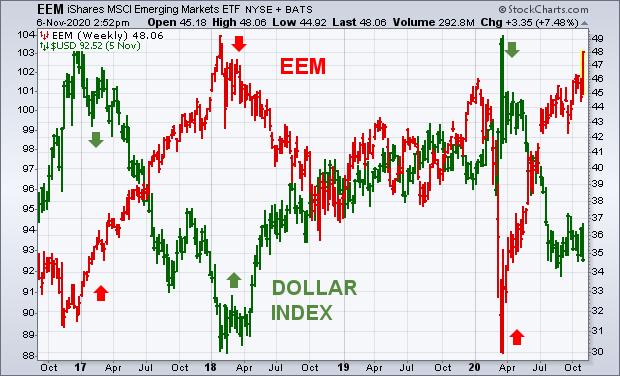 Chart 3EMERGING CURRENCIES ARE RISING AGAINST THE DOLLAR... China is leading an upturn in emerging market currencies against the dollar. Chart 4 shows the WisdomTree Emerging Currency Fund (CEW) rising this week to the highest level since March. Chart 5 shows the WisdomTree Chinese Yuan Fund (CYB) rising to the highest level in two years. Those gains are more direct results of a weaker dollar. That makes dollar-denominated debt more affordable for EM countries. A stronger Chinese yuan also makes global commodities more affordable. Stronger emerging currencies also boost the performance of Asian stock ETFs that are quoted in a weaker dollar.
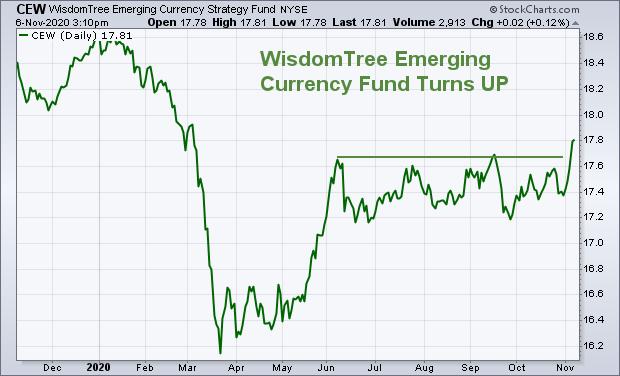 Chart 4
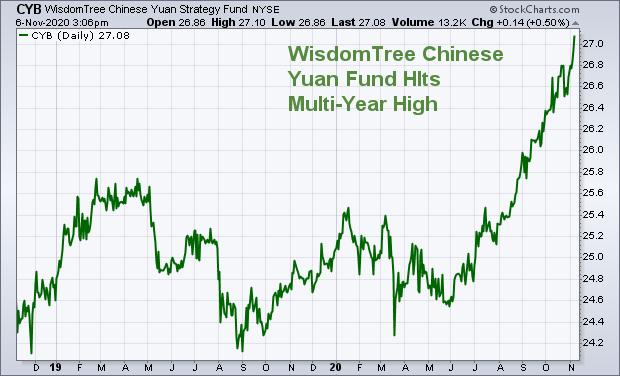 Chart 5
Editor's Note: This is an article that was originally published in John Murphy's Market Message on Friday, November 6th at 3:37pm ET.


