Let me preface my article by saying that I'm very bullish. I mean, like, extremely bullish. No, really, I'm talking CRAZY bullish. Historically, we've just entered a period, October 27th close through January 18th close, where the S&P 500 has gained ground 61 of the last 70 years. There's a very high probability, based on history, that we're heading higher. Technically, I see higher prices ahead as well. But let's get back to that October 27th through January 18th period. You might be saying, "well, we haven't ever witnessed anything like this!" And you'd be correct. The political divide, the COVID-19 pandemic, record piles of national debt, millions of Americans still unemployed, etc. The list goes on and on. But we've had issues at every election. We can debate back and forth which ones are more serious, but the point is there's a list of big problems every year and every election.
Wall Street says WE DO NOT CARE. End of story.
The historical numbers speak for themselves. From the October 27th close, just before every presidential election, to the following January 18th, here are the actual election-year S&P 500 returns (since 1950):
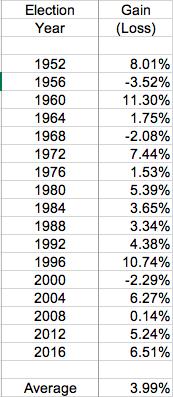
Of these 17 election years, 14 moved higher and the average gain of all 17 years was nearly 4%. Roughly half of these election years saw a gain of at least 5% and the two years with double digit returns - 1960 and 1996 - came in the midst of the last two secular bull markets. I believe we're in the midst of a secular bull market right now. In my opinion, history favors a post-election advance into 2021. Considering that we've had two cyclical bear markets in less than two years and we're approaching yet another all-time high, I believe it's difficult to refute the secular bull market theory.
So if we're truly heading higher, what's the best way to participate?
Stick With Leaders
We equal-weight 4 portfolios with 10 leading stocks every quarter. We've created these portfolios in the past couple years in order to help educate both professional and individual investors, showing that there's a better way to invest for your financial future than simply buying and holding a way-too-heavily-diversified ETF like the SPY (ETF that tracks the entire S&P 500). On the surface, buying the SPY seems great because you're investing in 500 of the largest companies in the world. But global economies, geopolitical concerns, currencies, central bank policies, management teams, etc. separate the strong from the weak. Take one look at the one-year performance of our 11 sectors:
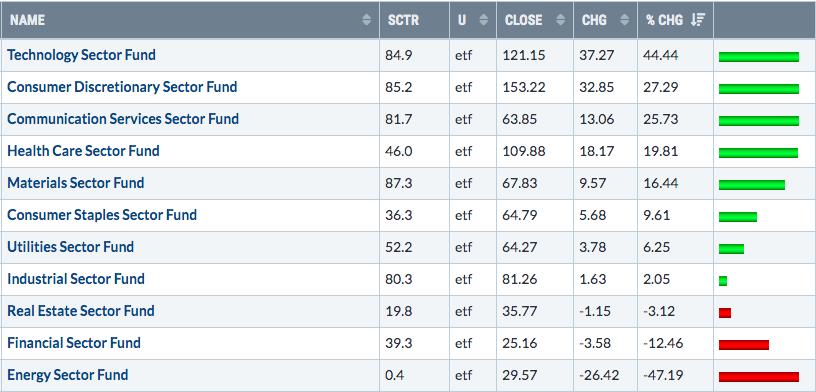
Which groups would you rather invest in? It's a pretty easy choice, isn't it? Energy (XLE), financials (XLF), real estate (XLRE), industrials (XLI) and utilities (XLU) have badly underperformed and are costing you thousands of dollars. Do you know their representation on that beautifully-diversified (sarcasm intended) SPY? The S&P 500 is market-cap weighted, so this isn't intended to be a depiction of weighting, but here are the number of companies included currently by sector:
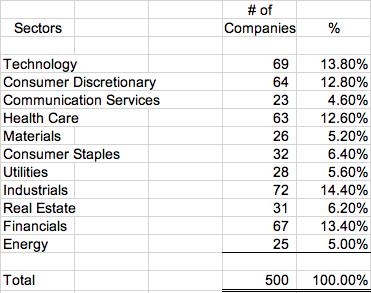
The S&P 500 has gained a little more than 14% over the past year. The bottom six sectors above underperformed that 14% level. So 255 companies on the S&P 500, or slightly more than half, belong to sectors that underperformed. Warren Buffett famously said, "diversification is a protection against ignorance." He didn't mean that in a derogatory manner; he was simply saying that if you do your homework, you can beat the market. At EarningsBeats.com, we do our homework. And, if you'd like, we'll do your homework for you. I believe we've developed a research platform that's unrivaled and we strive to improve it each and every day.
Let me give you a little bit of diversification perspective based on how we operate at EarningsBeats.com. I'll do so by breaking down our diversification over the past 4 quarters. Remember, we change our portfolios every 90 days and we include 10 equal-weighted stocks each quarter. So, over the past 4 quarters, we've included 40 stocks in our Model Portfolio. First, I'll show you our returns each quarter. (By the way, our quarters begin on November 19th, February 19th, May 19th, and August 19th. The reason for those dates is simple; we want to evaluate all of the latest earnings reports, with the majority of earnings season generally ending around that time of those four months.)
Here are the Model Portfolio results by quarter:
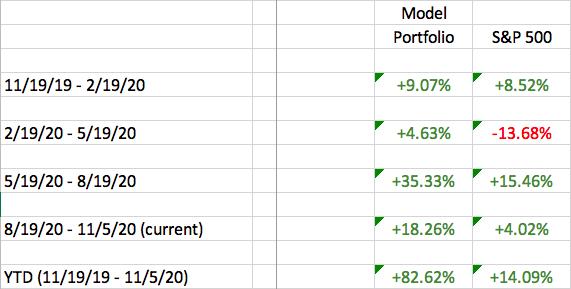
Our Model Portfolio is less than two weeks away from posting its 7th win vs. the S&P 500 in its 8 quarters since inception, including all four quarters in the past year. Unless we see a significant change in the next two weeks, our Model Portfolio will outperform the benchmark S&P 500 by DOUBLE DIGITS for the third consecutive quarter.
Now let's go back to that diversification table and take a look at the Model Portfolio's diversification vs. the S&P 500's:
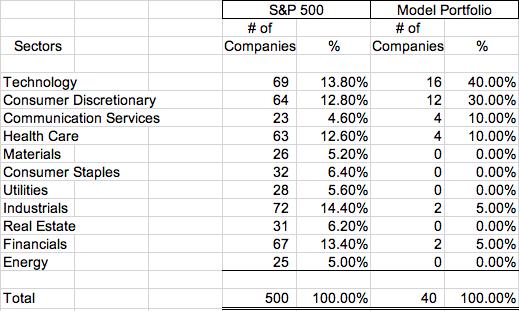
The significant outperformance that we've achieved is a direct result of doing our homework, following relative strength and riding the leaders. Has every stock worked out? Of course not. But we've had plenty of winners to offset those on the losing side.
If any of this is appealing to you, I encourage you to join me on Monday, November 9th, at 4:30pm ET for our "Sneak Preview: Top 10 Stocks" webinar. I'll go into much more detail into how we select our portfolios and provide various strategies to evaluate key sectors and industry groups. CLICK HERE for more information and to provide your name and email address to register for this event. We will email room instructions to everyone in our EarningsBeats.com community on Monday.
Happy trading!
Tom


