Since the March lows, the NASDAQ has seen its RSI approach or pierce the overbought 70 level on 11 different occasions. The only meaningful correction that's taken place on any of those 11 occurrences, though, has been the September selling. Historically, September is a poor month, so we shouldn't be too surprised by a 12-13% correction. It didn't help that the NASDAQ rose 9.6% in August! In one month! Then it tacked on more than 2% in the first two days of September. Yes, we were in dire need of some relief - and we got it.
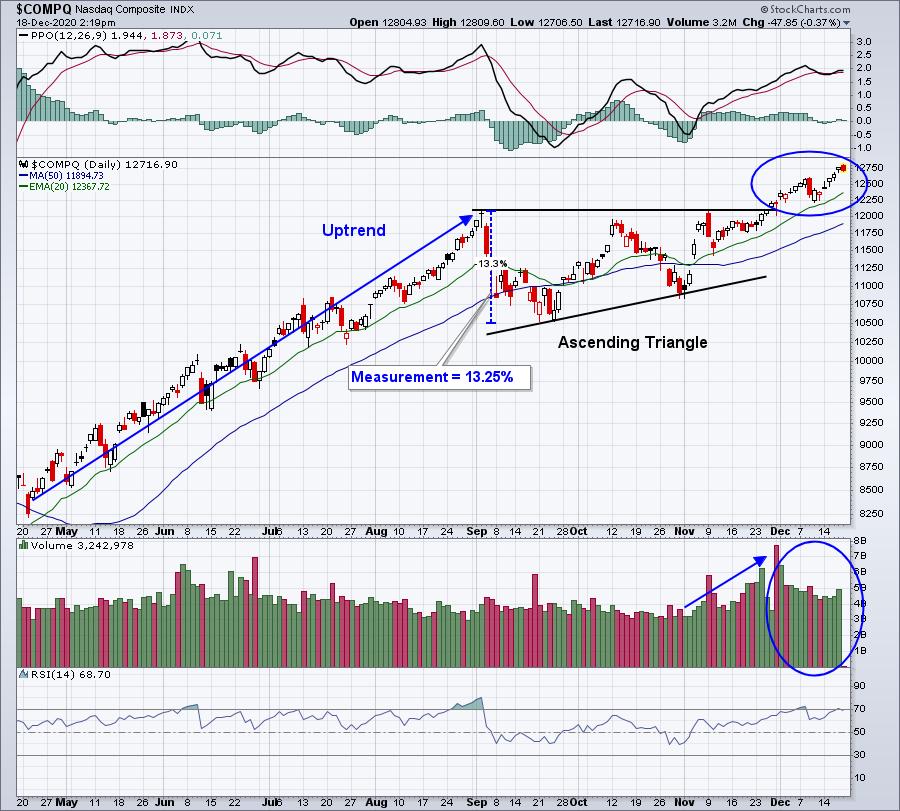
Since clearing the triple top established at the September high (12,074.06), October high (11,965.54) and the November high (12,108.07) on November 25th, however, the NASDAQ has tacked on another 5.54% in just 4 weeks. I understand the trepidation here after a surge higher. A trip back to test the rising 20-day EMA can happen at any time. I wouldn't bank on it happening, but if it did, I wouldn't be spooked. The following is a NASDAQ chart and I'll discuss a couple reasons why I believe this rally hasn't ended:
Reasons to remain bullish:
(1) We broke out of a very bullish ascending triangle continuation pattern that measures another 13.25% higher (initially) after confirming its breakout on strong volume. That measurement is roughly 13,700, another 1000 points higher than the current level.
(2) That volume reeks of accumulation. We're not just going higher; institutions are buying stocks by the fistful. If the volume doesn't impress you, then maybe the AD line will:
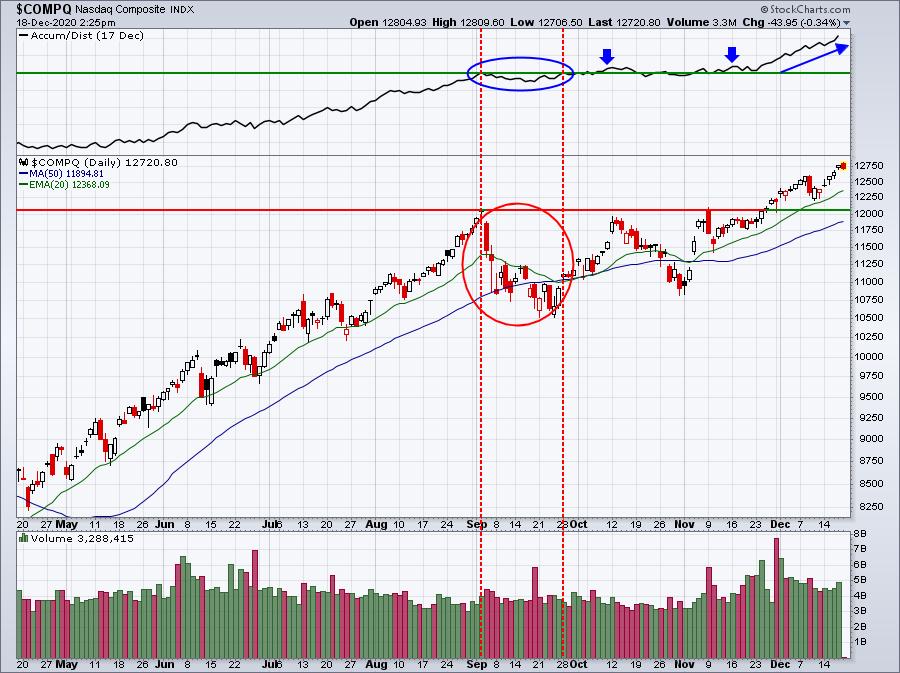
A couple more points to be made here about the obvious accumulation taking place:
(1) Look at the September "selling." Prices moved lower for sure, but the AD line held up beautifully. This is EXACTLY what we saw in March. While everyone was selling, institutions were buying every share they could get their hands on in certain sectors and industry groups. The same holds true now.
(2) Now look at that AD line as prices move higher. Do you see any "funny stuff" going on here? I sure don't. I believe stocks are being bought in droves heading into 2021.
Again, we might see a bit of profit-taking and rotation that carries us down to test our rising 20-day EMA, but I just don't see anything more than that. But that brings me to my final point.
Rotation.
This is a hallmark of secular bull market advances. Yes, some groups and some stocks will take a short-term beating because money rotates out of that group and into other groups. We saw software struggle for a few months, but now that group is rallying again. Over the past month, the hottest sector has been energy (XLE). Need proof? Here's a one-month snapshot of sector performance:
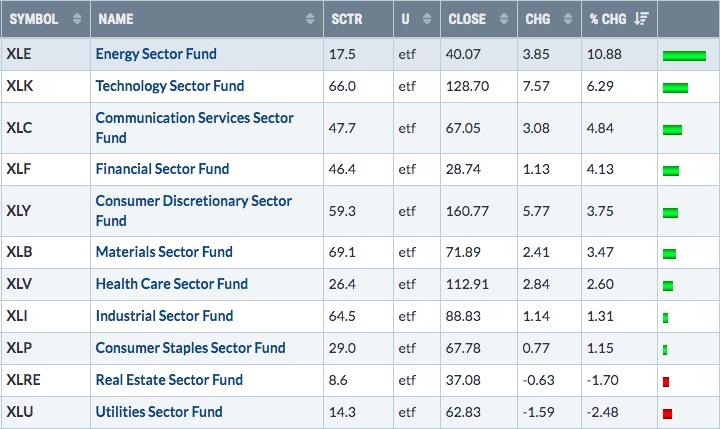
Energy has had a HUGE month by any measure. But rotation has taken its legs out from under it. Look at the last week's sector performance:
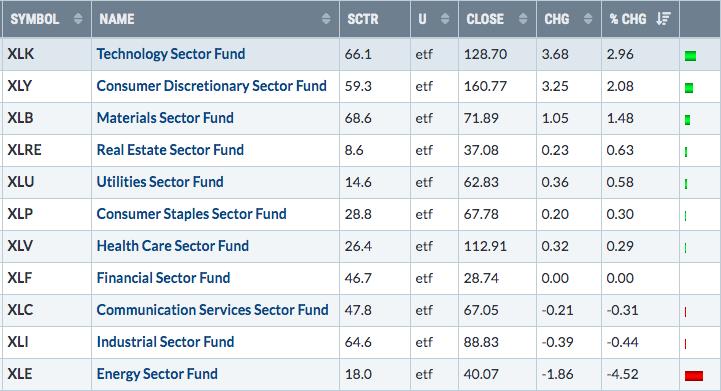
Profit-taking can surely be blamed for this. But also don't overlook monthly options expiration. After that big month, energy entered this week with TONS of net in-the-money call premium. The money was there for the taking by market makers, and I discussed this with EarningsBeats.com members on Tuesday night at our December Max Pain webinar. While the market has rallied, energy has not.
Getting back to my earlier overbought discussion, I continually update a Strong Earnings ChartList with companies that beat Wall Street estimates as to both revenue and EPS, are liquid (trade at least 200,000 shares per day) and look solid technically. I just updated this ChartList this afternoon and there are currently 491 charts on this list. While the NASDAQ and S&P 500 might be showing short-term overbought conditions, many stocks on this list are not. This gets back to rotation. There's no need to chase the overbought stocks, because there are plenty of others that have already seen profit-taking and are poised to move higher - and without all the risk that chasing entails. I ran scans to break down these 491 Strong Earnings ChartList stocks by RSI level. Check out the distribution of RSI levels:
- Number of stocks with RSIs over 90: 1
- Number of stocks with RSIs from 80-90: 21
- Number of stocks with RSIs from 70-80: 94
- Number of stocks with RSIs from 60-70: 164
- Number of stocks with RSIs from 50-60: 141
- Number of stocks with RSIs from 40-50: 65
- Number of stocks with RSIs below 40: 5
That's a fairly solid distribution among various levels of overbought and oversold. More than 40% of our Strong Earnings ChartList stocks have an RSI reading below 60. Clearly, there are plenty of stocks that are not overbought, so don't avoid stocks because of a general belief that they've run too far. There are opportunities everywhere!
This is my final ChartWatchers newsletter article of the year. As 2020 draws to a close, I want to thank everyone in our StockCharts.com and EarningsBeats.com communities. We're rewarding our EarningsBeats.com members with our best annual deal of the year - sign up for 12 months and we'll throw in 2 free months. Annual members also can attend our MarketVision 2021 event tomorrow at no additional charge ($197 value). That special can be found HERE.
I also want to thank our FREE EB Digest community and everyone at StockCharts.com. On Monday, December 21st, in our EB Digest newsletter, I'll feature a trading candidate from this Strong Earnings ChartList that's not overbought at all. I'll also provide a FREE link to our Strong Earnings ChartList - all 491 stocks ANNOTATED with key price support levels to watch. You'll be able to download this ChartList directly into your StockCharts.com account, if you're a StockCharts.com Extra or Pro member. You must SIGN UP for our EB Digest newsletter prior to Monday morning to gain access to this ChartList, however. CLICK HERE to join our EB Digest newsletter. There is no credit card required and you may unsubscribe at any time.
Happy trading!
Tom


