The price of crude oil continues to rise and is pulling energy shares along with it. Chart 1 shows the United States Oil Fund (USO) surging to the highest level in eight months after clearing its previous high formed during August. The USO has also climbed above its 200-day moving average for the first time since the start of the year. That's helping make energy Thursday's strongest sector.
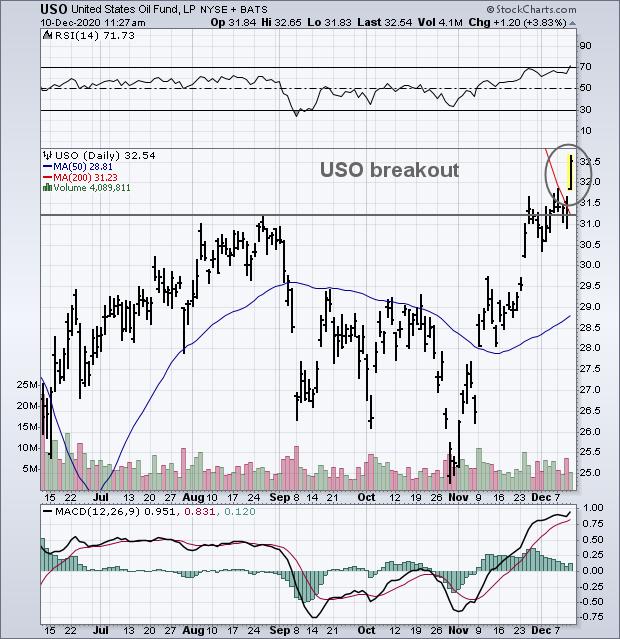 Chart 1
Energy stocks have gone from the market's weakest sector this year to the strongest over the past couple of months. And they're Thursday's strongest sector again. Three of the energy ETFs shown in previous messages are trading at six month highs. Chart 2 shows the Energy Sector SPDR (XLE) trading at the highest level since June. Its relative strength ratio in the upper box is rising as well. The same is true of the two other energy ETFs shown in Charts 3 and 4. All three appear headed toward their previous highs formed in June. The VanEck Vectors Oil Services ETF (OIH) in Chart 4 has been the strongest of the three; and the closest to its June high. In addition, its 50-day average has crossed over its 200-day line which is another bullish indication (blue circle).
 Chart 2
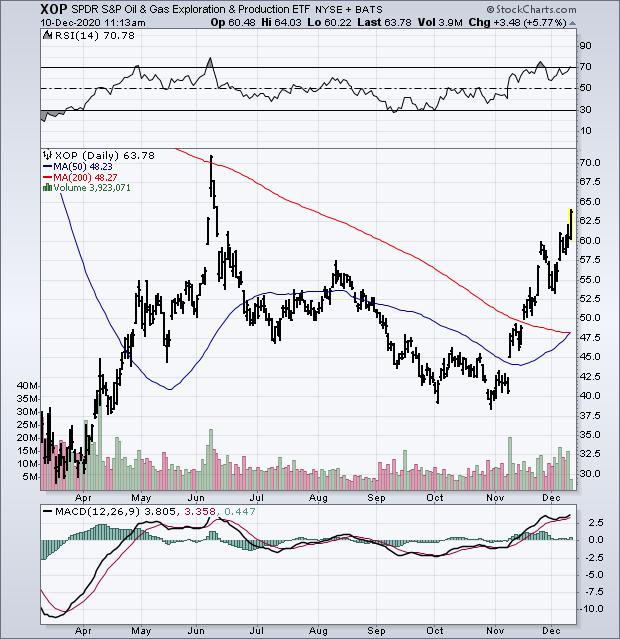 Chart 3
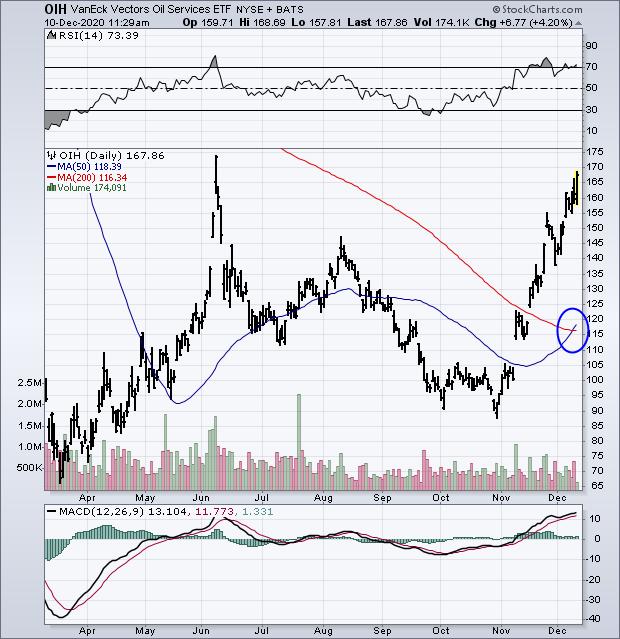 Chart 4
Editor's Note: This is an article that was originally published in John Murphy's Market Message on Thursday, December 10th at 11:38am ET.


