(This is a reprint of the subscriber-only "DecisionPoint Alert" article from 12/22/2020. Merry Christmas & Happy New Year to all from Carl & Erin Swenlin)
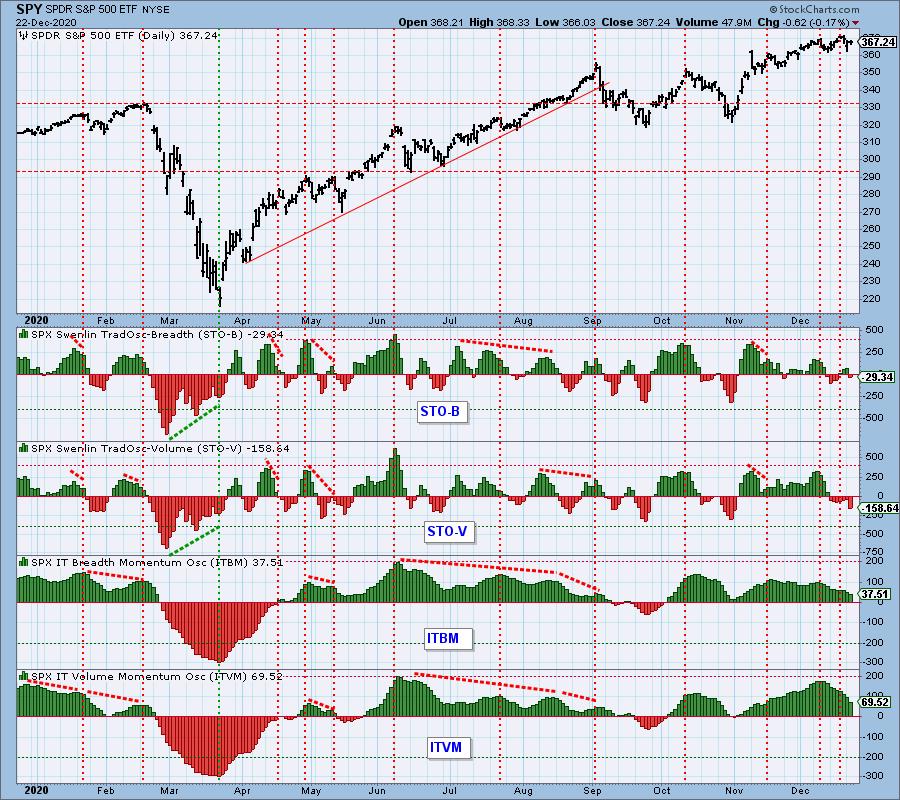
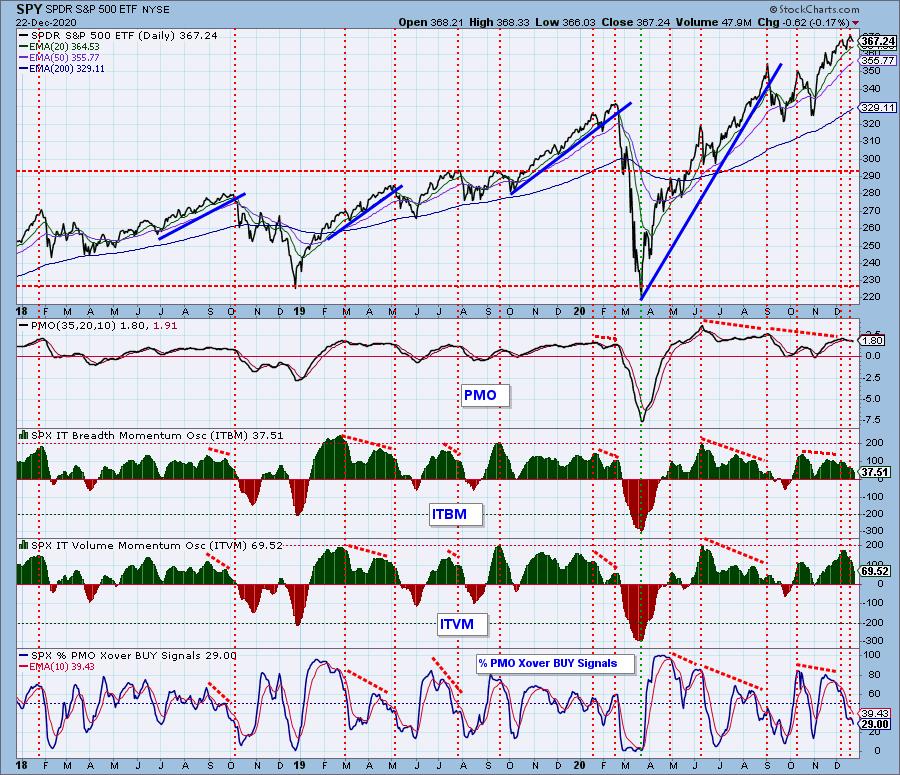
One of the ways we measure market bias is by looking at the histograms of the Swenlin Trading Oscillators (STOs) and the ITBM/ITVM. You'll note that, since the November low, we have had a strong bullish bias, as represented by the "green" on the chart. We've seen deterioration on the STOs. Because they are short-term indicators, we've had a bit more bouncing around, which gives us a neutral bias overall in the short term. The intermediate-term indicators of the ITBM/ITVM have been sporting a strong and solid bullish bias; however, that has changed drastically since the initial December top. I'll talk more about these indicators individually below, but I believe it is important to see them on the same chart now and then.
The DecisionPoint Alert Weekly Wrap presents an end-of-week assessment of the trend and condition of the Stock Market, the U.S. Dollar, Gold, Crude Oil and Bonds. The DecisionPoint Alert daily report (Monday through Thursday) is abbreviated and gives updates on the Weekly Wrap assessments.
Watch the latest episode of DecisionPoint on StockCharts TV's YouTube channel here!
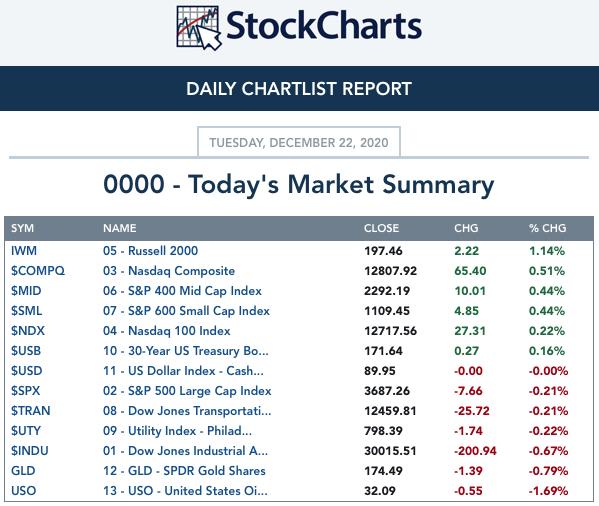
MAJOR MARKET INDEXES
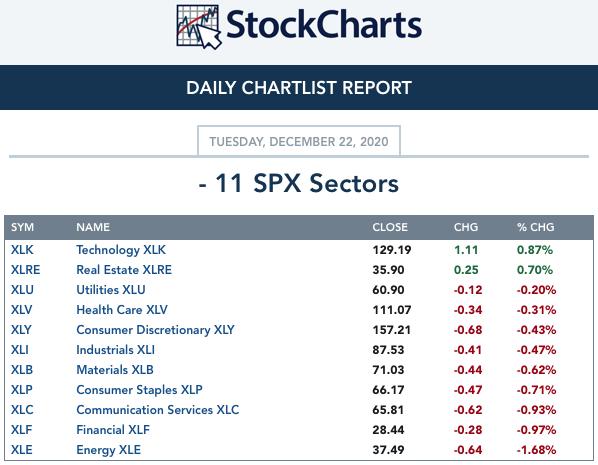
SECTORS
Each S&P 500 Index component stock is assigned to one, and only one, of eleven major sectors. This is a snapshot of the Intermediate-Term (Silver Cross) and Long-Term (Golden Cross) Trend Model signal status for those sectors.
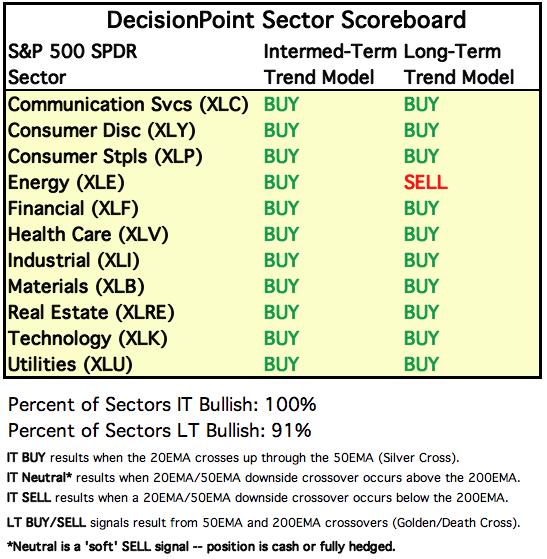
CLICK HERE for Carl's annotated Sector charts.
THE MARKET (S&P 500)
IT Trend Model: BUY as of 5/8/2020
LT Trend Model: BUY as of 6/8/2020
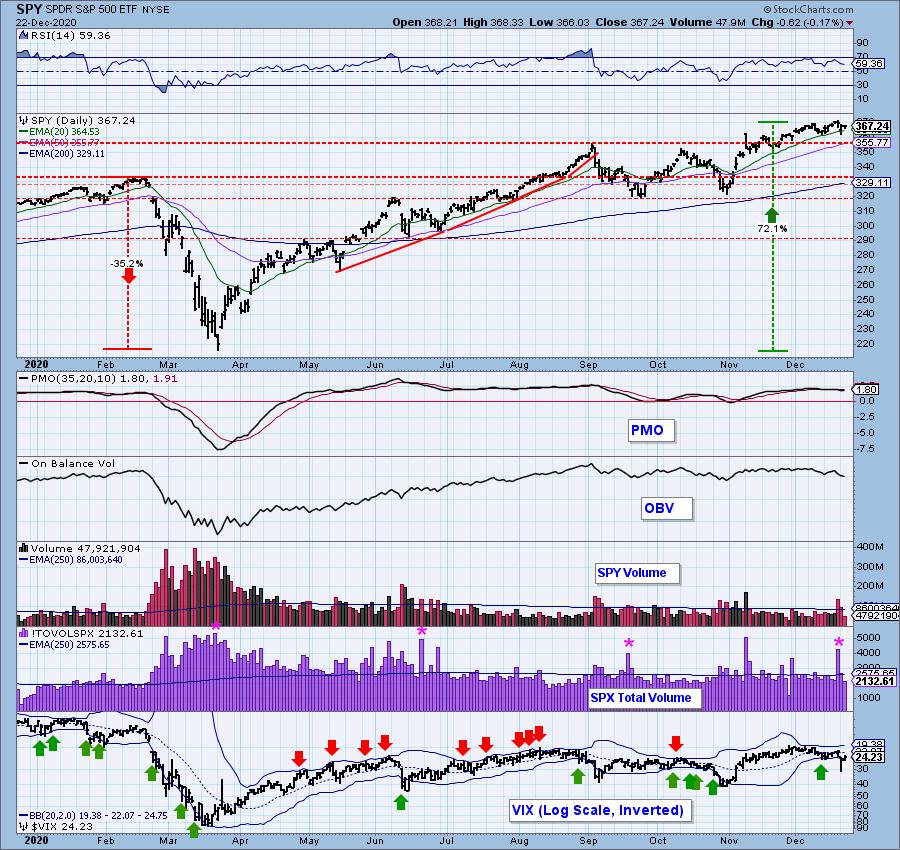
SPY Daily Chart: The market was down slightly today, but it logged a much higher low than yesterday's. This only gets price back within the bearish rising wedge. The PMO has topped below its signal line and the negative OBV divergence is still in play. The VIX is rising again on the inverted scale, but it remains underneath its EMA, which suggests market weakness.
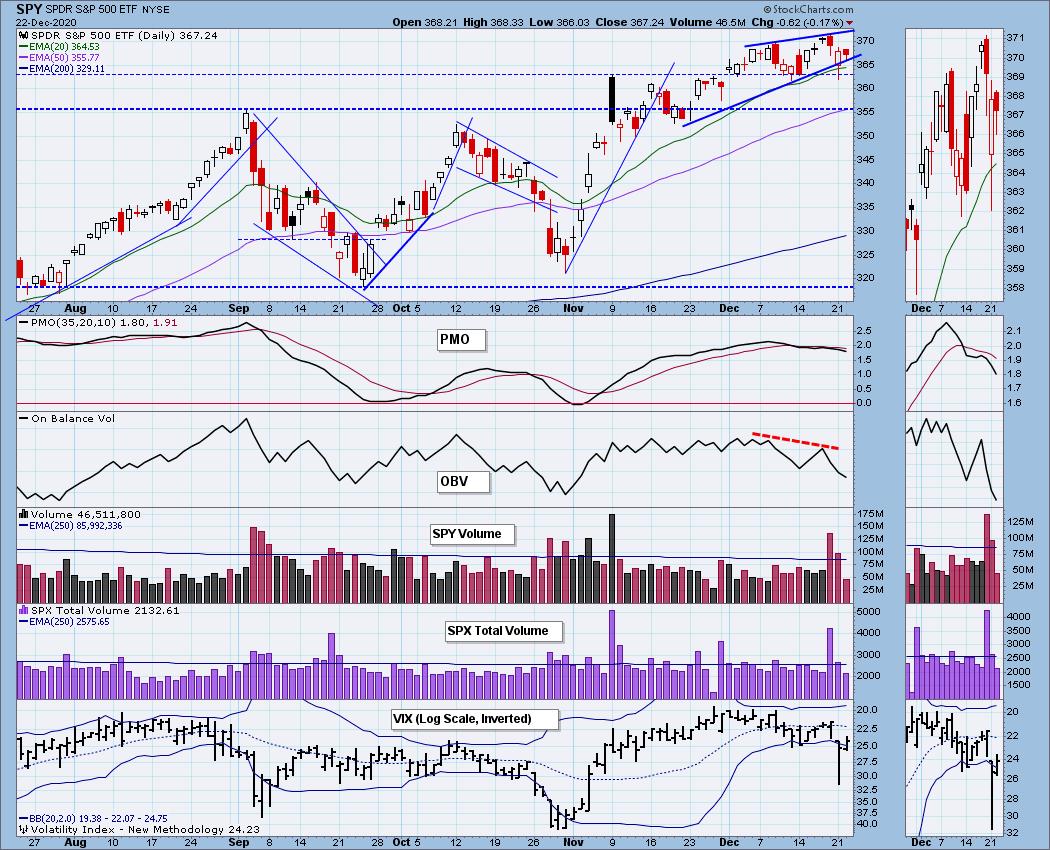
The RSI does remain positive primarily due to price moving mostly sideways through November and December. Total volume was very low, but I suspect that is due to holiday trading.

It's Free!
***Click here to register for this recurring free DecisionPoint Trading Room on Mondays at Noon ET!***
Did you miss the 12/14 trading room? Here is a linkto the recording -- access code: 7dJNVe6+
For best results, copy and paste the access code to avoid typos.
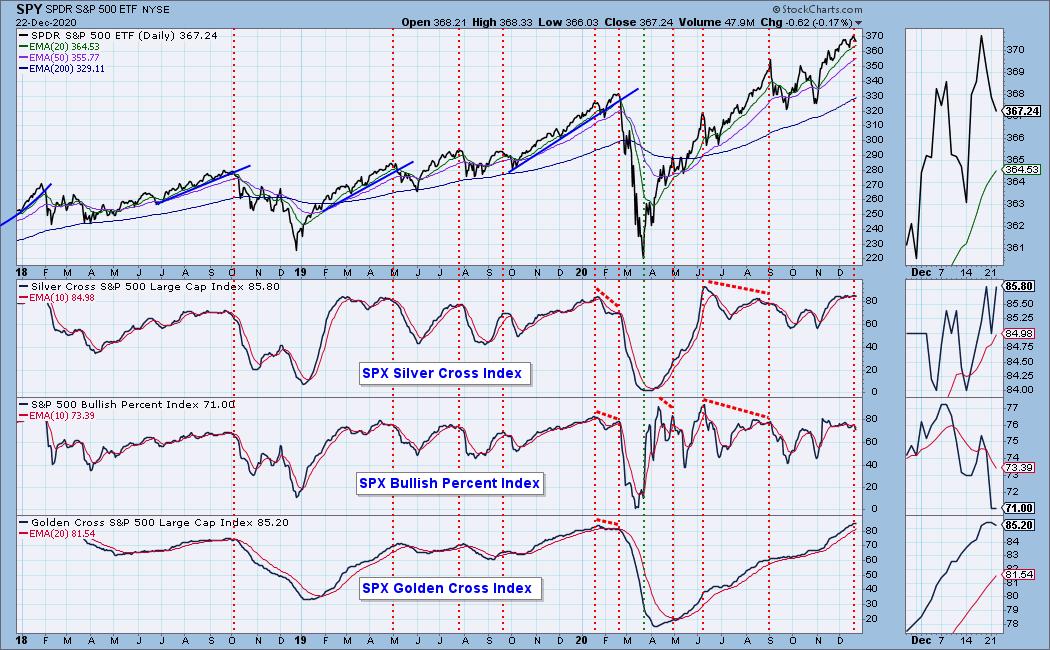
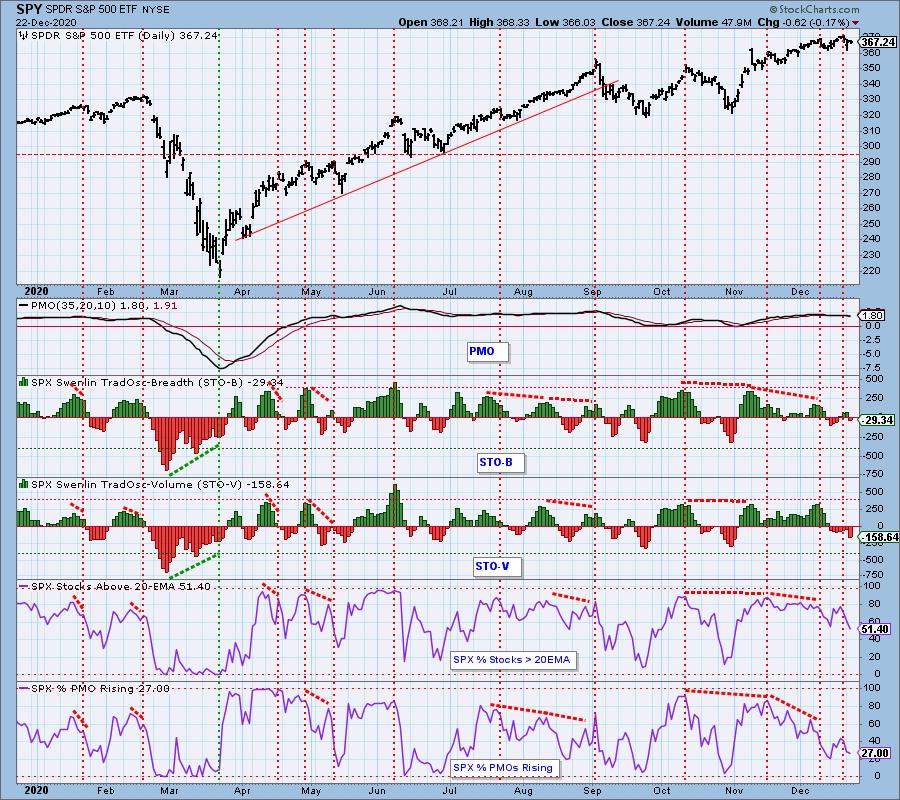
Participation: The following chart uses different methodologies for objectively showing the depth and trend of participation for intermediate- and long-term time frames.
- The Silver Cross Index (SCI) shows the percentage of SPX stocks on IT Trend Model BUY signals (20-EMA > 50-EMA).
- The Golden Cross Index (GCI) shows the percentage of SPX stocks on LT Trend Model BUY signals (50-EMA > 200-EMA).
- The Bullish Percent Index (BPI) shows the percentage of SPX stocks on Point & Figure BUY signals.
What really concerns me about this chart is the topping GCI. Note the previous tops nearly always occur at cardinal tops. The SCI turned up and the BPI was flat. Overall, both of these indicators are indecisive at best. Ultimately, they are flat and toppy, which is not good for the market either.
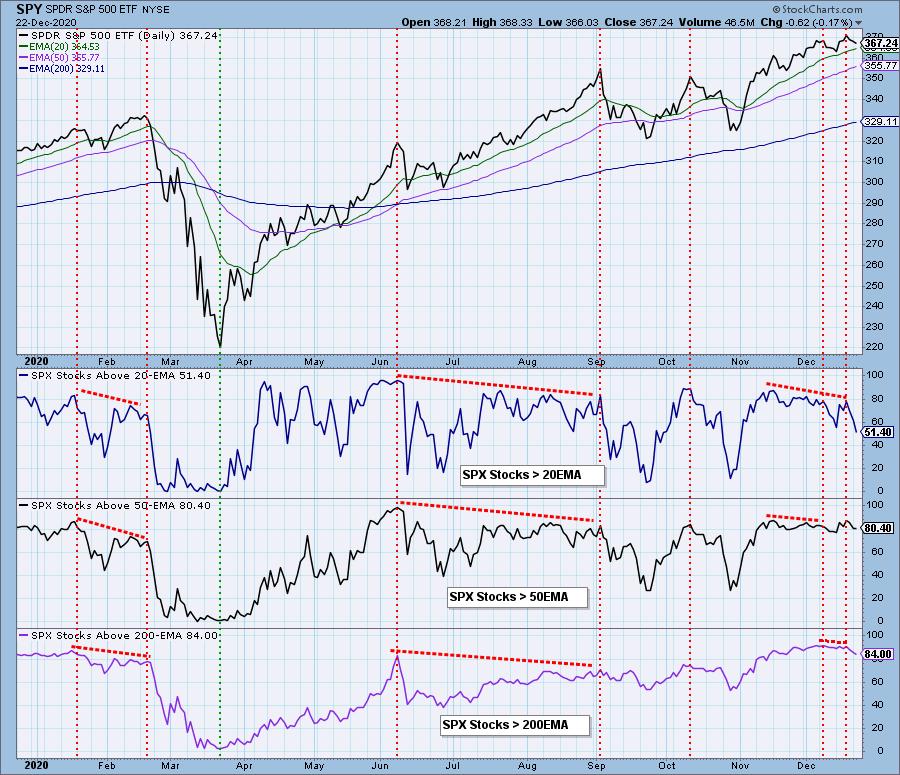
We continue to see deterioration on components of the SPX as more and more lose support at their 20-/50-/200-EMAs.
Climactic Market Indicators: No climaxes today. We saw a slight expansion of New Highs on a down day, which could be considered somewhat positive.
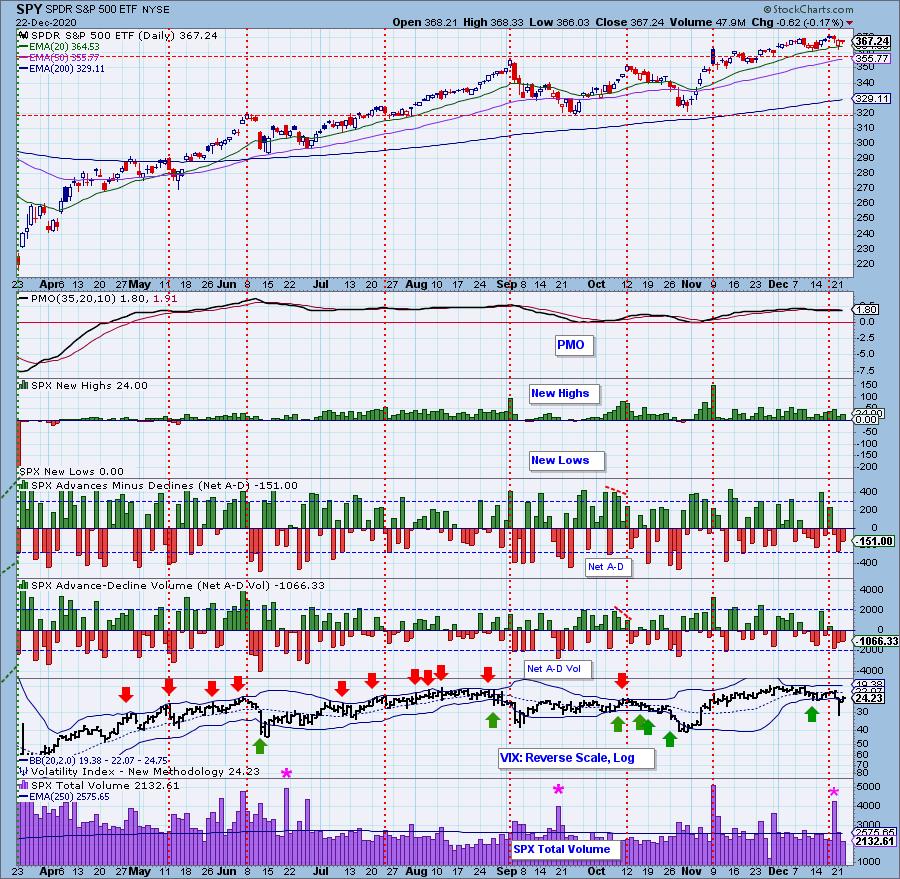
Short-Term Market Indicators: The short-term market trend is UP and the condition is NEUTRAL.
I was surprised to see a spike lower on the STO-V, but I don't want to read too much into this given total volume was so low. That could've affected this reading. Ultimately, both indicators are falling, suggesting more downside for the market. Readings are somewhat oversold in the near term, but we aren't seeing oversold readings on %Stocks > 20-EMA. The %PMOs Rising is nearing oversold territory.
Intermediate-Term Market Indicators: The intermediate-term market trend is UP and the condition is OVERBOUGHT. The market bias is SOMEWHAT BULLISH.
IT Indicators continue to drop. The ITBM and ITVM are starting to move Neutral, but, for the time being, they are still showing some bullish bias. We now have less than 30% of SPX stocks with their PMOs above their signal line. It is moving lower quickly and isn't all that oversold.
CONCLUSION: Today's candlestick doesn't look too bad given there was a decline today. Price remains inside a bearish rising wedge. The STOs turned down today with a vengeance, which suggests a coming breakdown. The bullish bias is no longer in play in the short term and it is disintegrating in the intermediate term. The market continues to act toppy, but it also remains above the November top. Given bullish seasonality, I don't expect a serious breakdown from this wedge just yet.
Have you subscribed the DecisionPoint Diamonds yet? DP does the work for you by providing handpicked stocks/ETFs from exclusive DP scans! Add it with a discount! Contact support@decisionpoint.com for more information!
INTEREST RATES
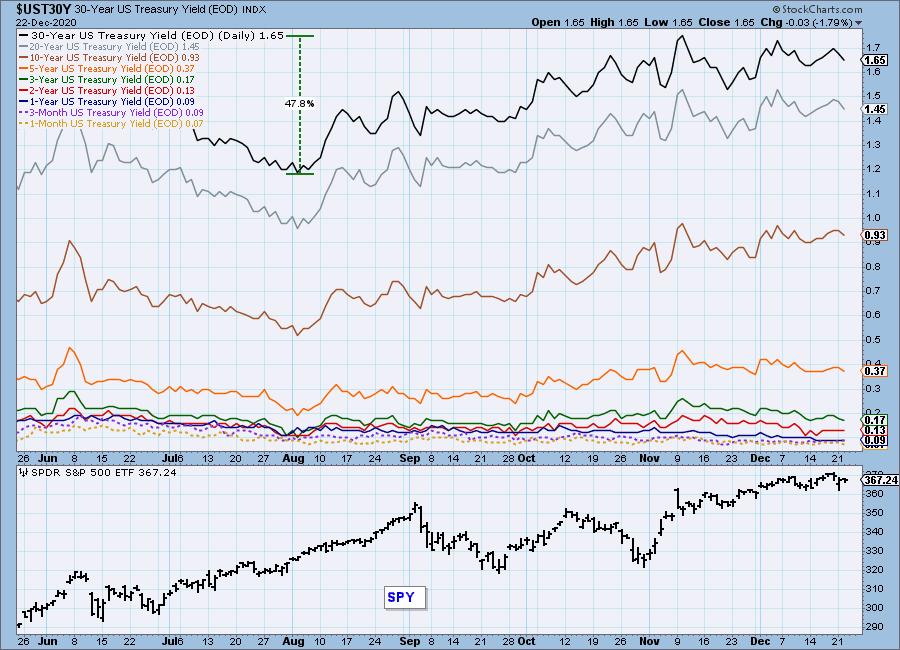
This chart is included so we can monitor rate inversions. In normal circumstances, the longer money is borrowed, the higher the interest rate that must be paid. When rates are inverted, the reverse is true.
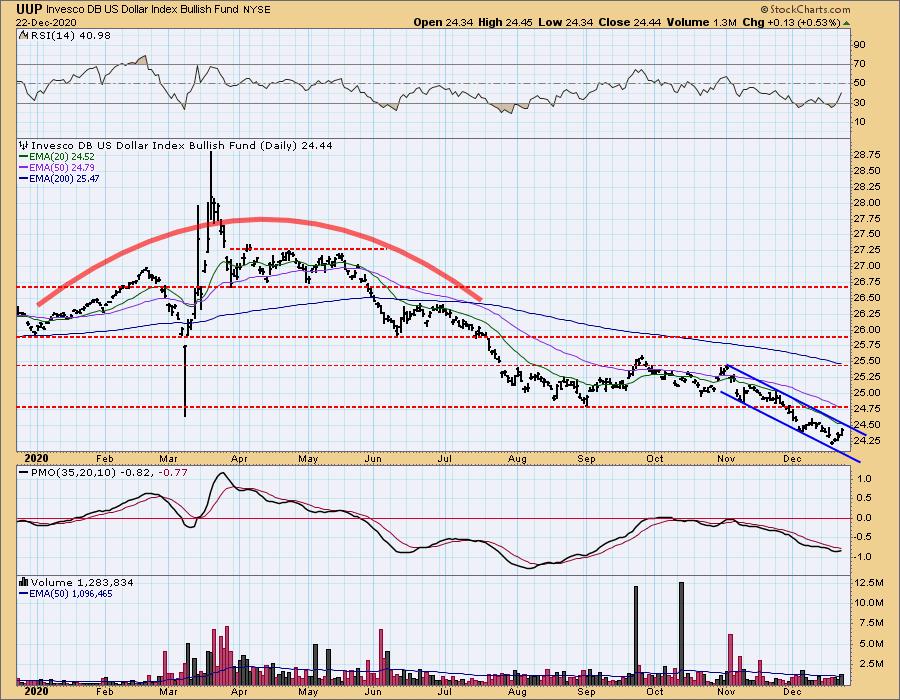
DOLLAR (UUP)
IT Trend Model: NEUTRAL as of 5/28/2020
LT Trend Model: SELL as of 7/10/2020
UUP Daily Chart: I've annotated a declining trend channel. Price has bounced off the bottom and is headed up to test the top again. While we are seeing improvement on the RSI and PMO, we saw this at the previous December low and the rally didn't even test overhead resistance at the top of the declining trend channel. You'll also note that the top of the declining trend channel is right at the 20-EMA. This means that price must take out two resistance levels. If it can do that, I'll rethink my bearish position on the Dollar.
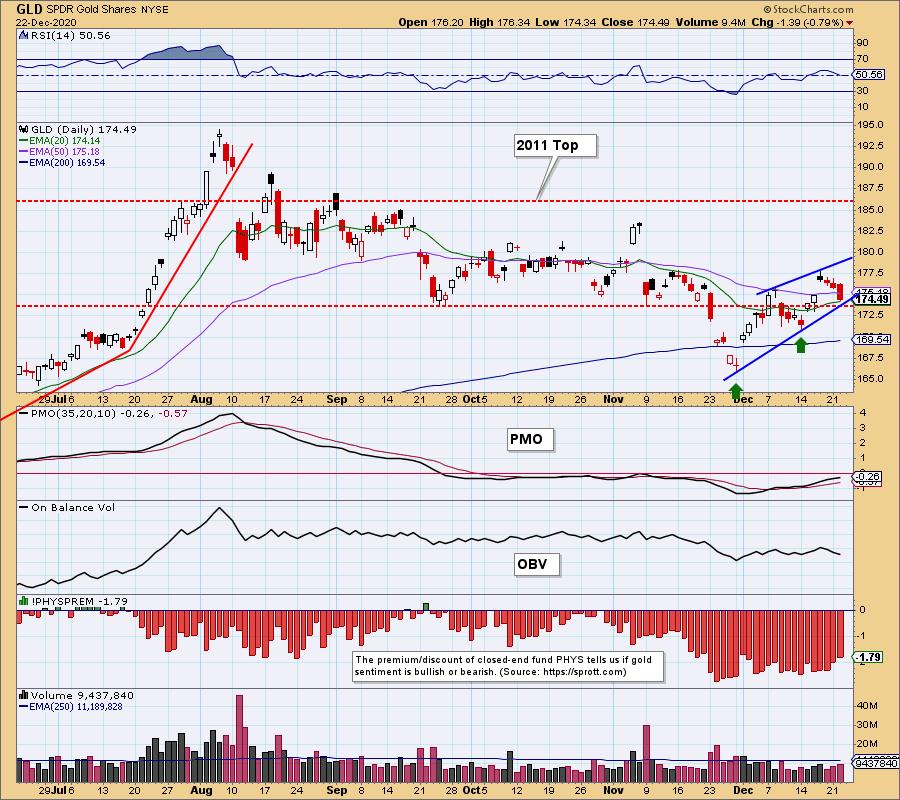
GOLD
IT Trend Model: NEUTRAL as of 10/14/2020
LT Trend Model: BUY as of 1/8/2019
GOLD Daily Chart: I really thought this was going to be Gold's time to shine, but it is already starting to tarnish. At this point, it is traveling within a bearish rising wedge, similar to the SPY's. Today's pullback did keep price above the 20-EMA and the September low. The rising bottoms trendline that forms the bottom of the wedge is also holding up. I'll likely reverse my bullish position on Gold if this important area of support is broken.
(Full disclosure: I own GLD.)
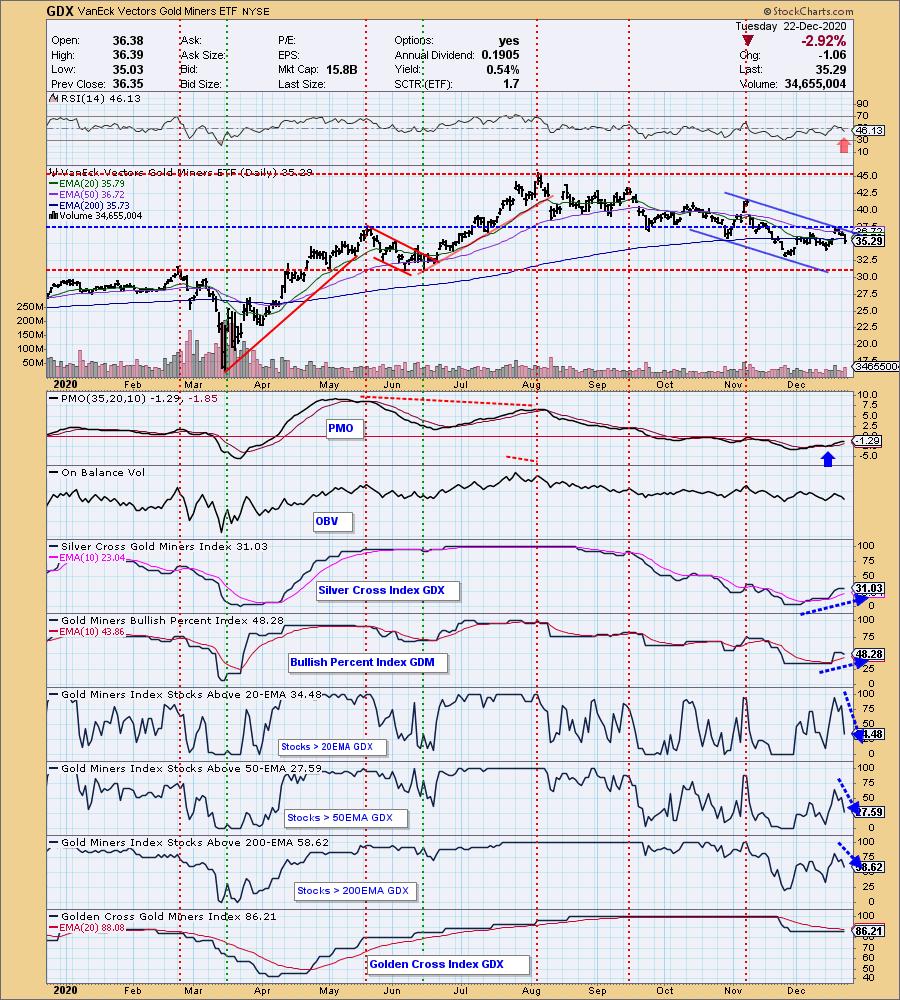
GOLD MINERS Golden and Silver Cross Indexes: Miners have just officially formed a declining trend channel. The RSI has turned negative and important support has been lost at the 20-EMA. The PMO is still on a BUY signal, but it has begun to turn over below the zero line. On the bullish side, we have rising trends on the SCI and BPI. On the bearish side, GDX members are losing support at the 20-/50-/200-EMAs.
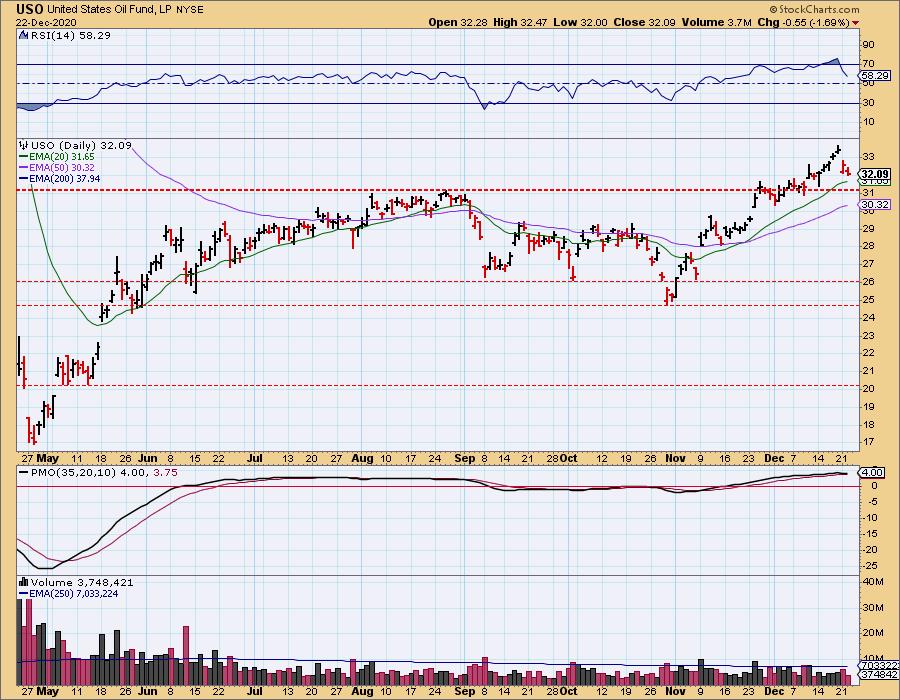
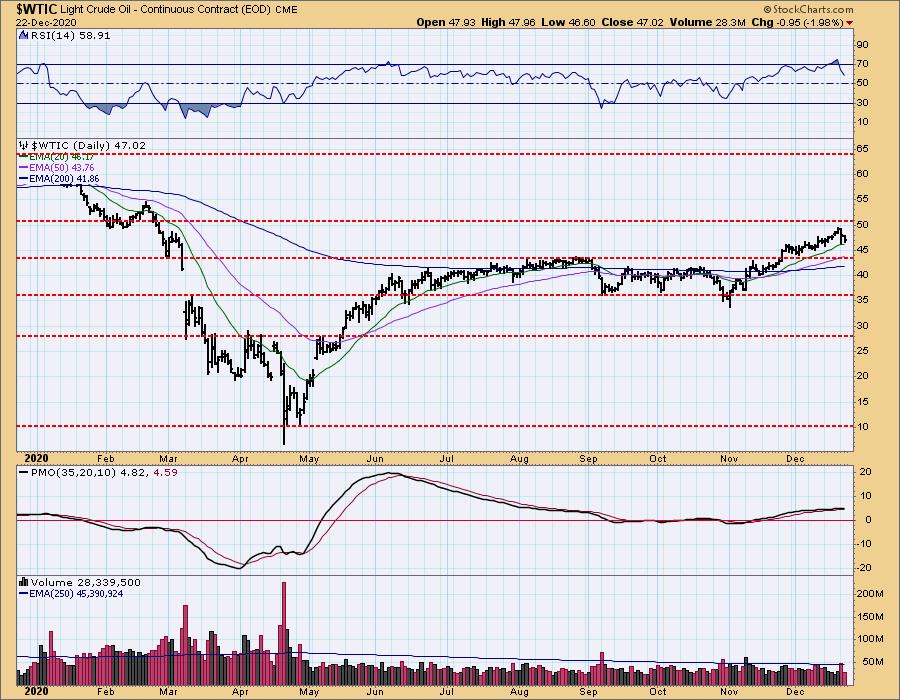
CRUDE OIL (USO)
IT Trend Model: BUY as of 10/20/2020
LT Trend Model: SELL as of 2/3/2020
USO Daily Chart: The pullback in Oil continued today with another deep decline. The RSI is still positive, but the PMO has topped and could generate a crossover SELL signal rather quickly. However, I'm not that bearish on USO given that price is maintaining above the 20-EMA, just like it is on $WTIC.
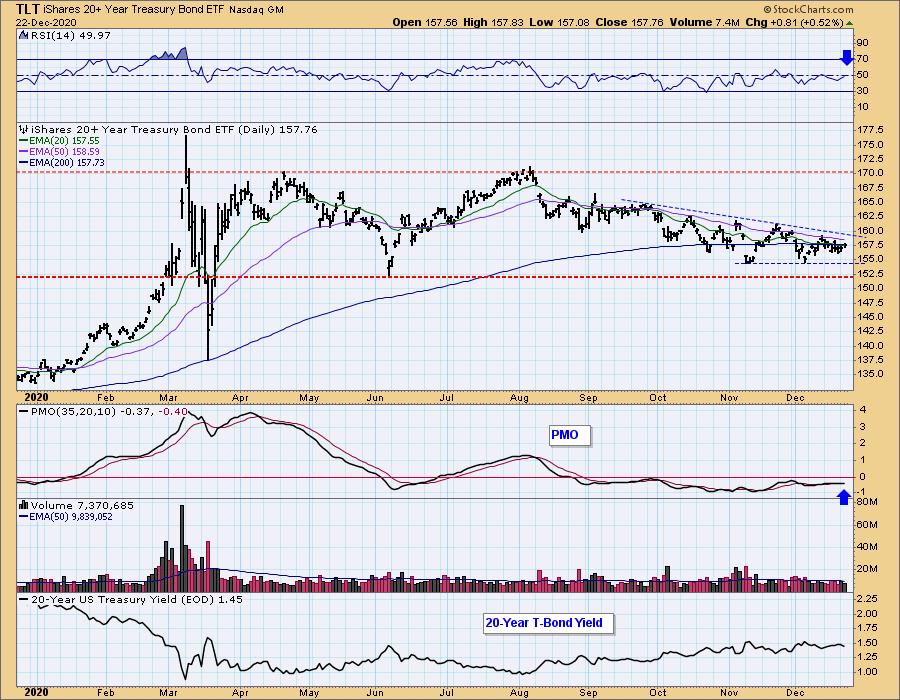
BONDS (TLT)
IT Trend Model: NEUTRAL as of 8/27/2020
LT Trend Model: BUY as of 1/2/2019
TLT Daily Chart: It appears that price has bounced and formed a higher low. However, overhead resistance at the 50-EMA is stout. The RSI is negative, but it is improving. I can't get bullish until I see a breakout above the 50-EMA. For now, I would expect more sideways movement.
(Full Disclosure: I own TLT.)
Technical Analysis is a windsock, not a crystal ball.
Happy Charting! - Erin
Disclaimer: This blog is for educational purposes only and should not be construed as financial advice. The ideas and strategies should never be used without first assessing your own personal and financial situation, or without consulting a financial professional. Any opinions expressed herein are solely those of the author, and do not in any way represent the views or opinions of any other person or entity.
NOTE: The signal status reported herein is based upon mechanical trading model signals, specifically, the DecisionPoint Trend Model. They define the implied bias of the price index based upon moving average relationships, but they do not necessarily call for a specific action. They are information flags that should prompt chart review. Further, they do not call for continuous buying or selling during the life of the signal. For example, a BUY signal will probably (but not necessarily) return the best results if action is taken soon after the signal is generated. Additional opportunities for buying may be found as price zigzags higher, but the trader must look for optimum entry points. Conversely, exit points to preserve gains (or minimize losses) may be evident before the model mechanically closes the signal.
Helpful DecisionPoint Links:
DecisionPoint Alert Chart List
DecisionPoint Golden Cross/Silver Cross Index Chart List
DecisionPoint Sector Chart List
Price Momentum Oscillator (PMO)
Swenlin Trading Oscillators (STO-B and STO-V)
DecisionPoint is not a registered investment advisor. Investment and trading decisions are solely your responsibility. DecisionPoint newsletters, blogs or website materials should NOT be interpreted as a recommendation or solicitation to buy or sell any security or to take any specific action.


