Prices are determined by the attitude of market participants to the emerging fundamentals. Fortunately for us technicians, these attitudes move in trends, and once a trend gets underway it tends to perpetuate. Provided it is not overstretched, we can reasonably assume that that trend will continue. It's in that spirit that I offer four probable themes for at least the first half of 2021. Three are already established, while one is pointing in the direction of a change and deserves further monitoring.
1. A Bullish Stock Market
The stock market has risen impressively since last spring, but many indicators, which have an impressive long-term record, have only just turned bullish. One example is featured in Chart 1. It's the ratio between stocks and bonds, which has clearly broken out from a right-angled broadening formation. This type of formation is particularly bullish relative to its size. That's probably because it represents a reverse head-and-shoulders, but is so bullish that it does not have enough time to complete the right shoulder. The current breakout obtains credibility due to the fact that the long-term KST has just gone bullish. The green arrows show that previous reversals have been consistently followed by a higher ratio.
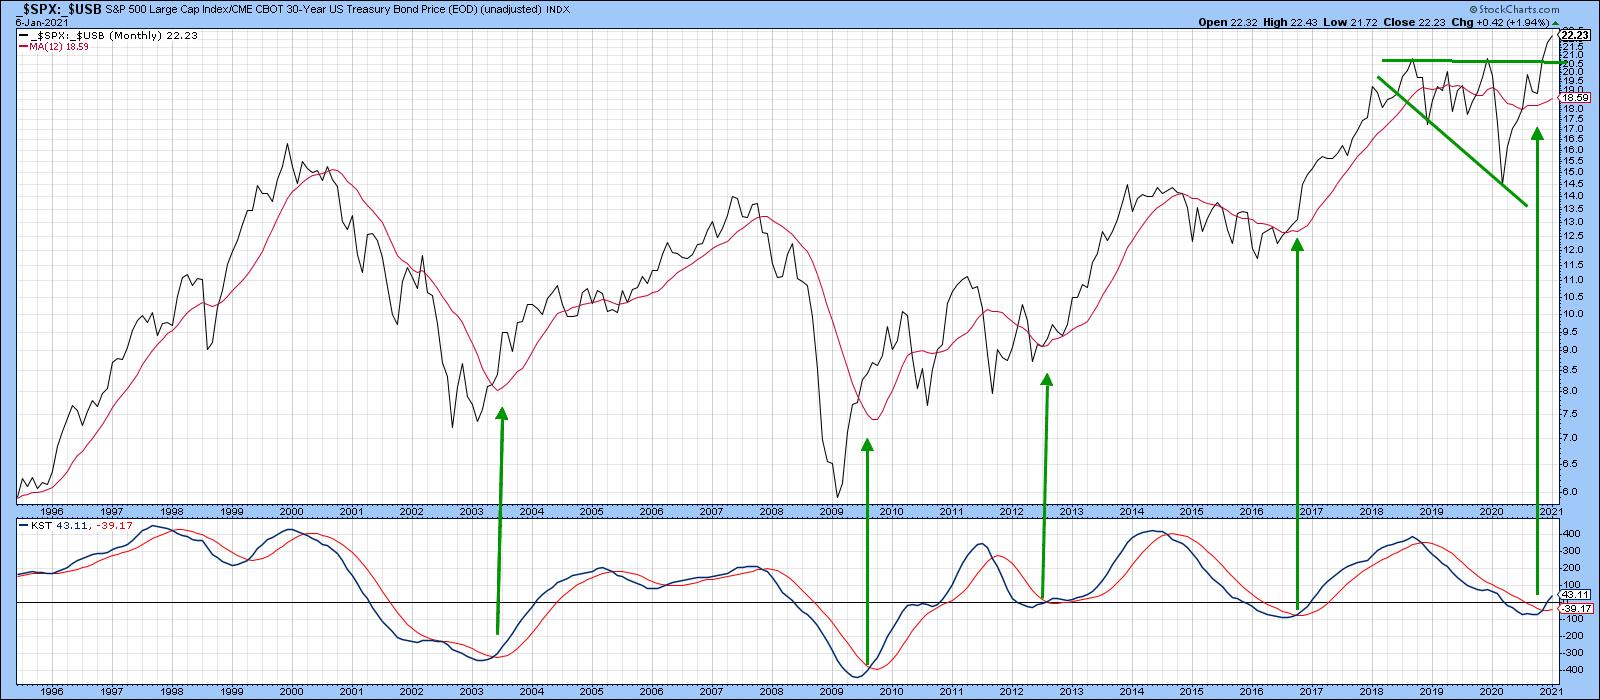 Chart 1
This relationship, of course, only tells us that stocks are likely to outperform bonds, not that they will rally in an absolute sense. Chart 2, on the other hand, demonstrates that these KST buy signals are consistently positive for the S&P Composite itself. Based on its currently subdued position, just above zero, it's not a stretch to say that stocks are headed higher in 2021. Now I am not going to rule out a sharp, unpredictable and unexpected corrections along the way, as some parts of the market are pretty frothy right now. However, I do believe that investors will be better served focusing on the big picture, rather than worrying about a correction of indeterminate size that may or may not develop.
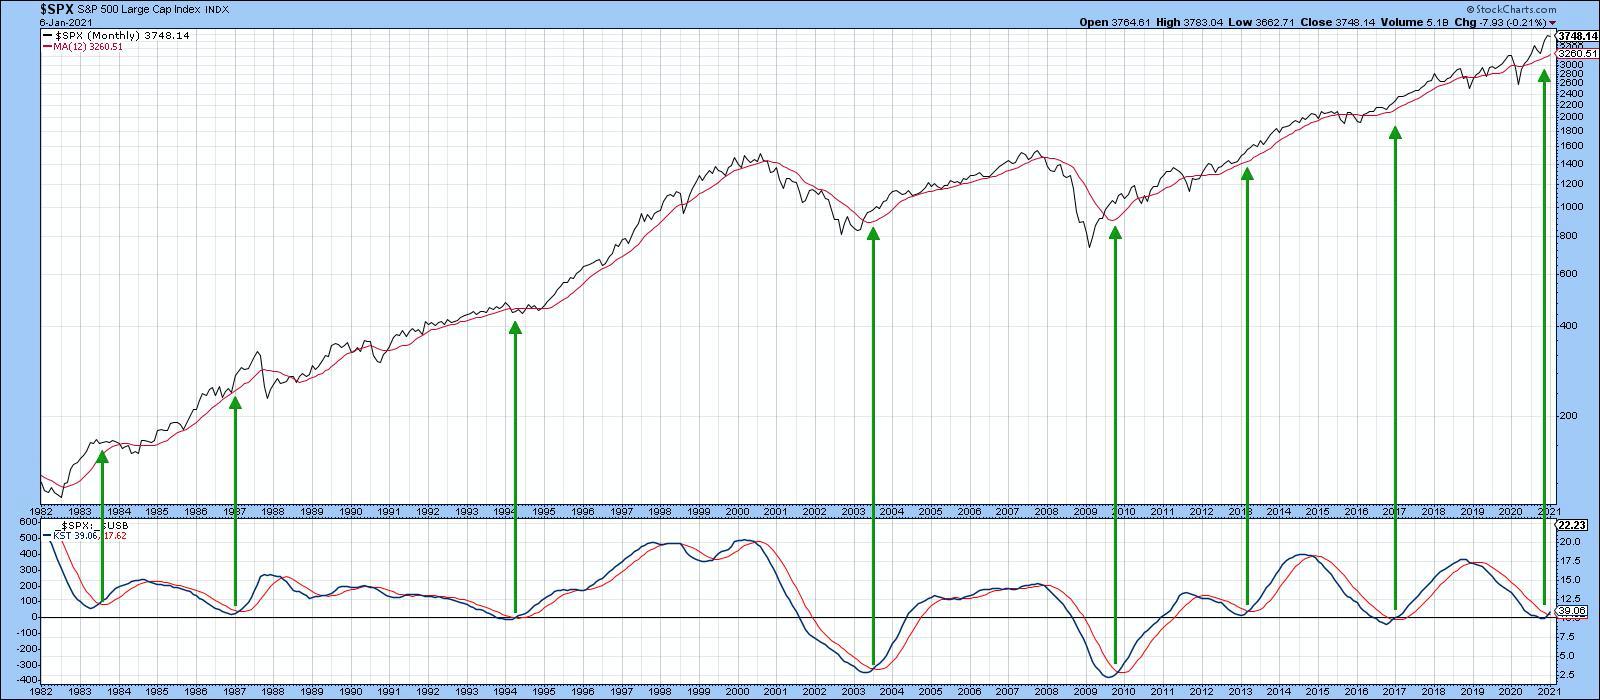 Chart 2
2. Bullish Commodities
Our second theme arises from the fact that the recovery has reached a point where it is consistent with a trend of rising commodities, a concept that you can read about here. Once again, there are many primary trend indicators that I could point to, but a consistent one is the ultimate inflation-deflation relationship, that being the ratio between commodities and bonds - or, more specifically, its long-term KST. Chart 3 compares it to the CRB Composite. When the KST bottoms, it signals, as far as the financial markets are concerned, that the business cycle has begun its inflationary phase. That means commodities have stopped retreating and begun to firm up. A bit later, bond yields stabilize and strengthen up up in anticipation of forthcoming inflationary pressures. As a result, upside reversals in the Commodity/Bond KST signal higher commodity prices.
The latest reversal developed a couple of months ago. Now, the price has managed to break above its 24-month MA and re-cross the (red dashed) head-and-shoulders neckline. It now stands right at its 2009-2020 secular down trendline. Since the bull market is in an early phase, that line is likely to be penetrated in 2021. Other markets likely to benefit from higher commodity prices are commodity-sensitive currencies, such as the Canadian and Aussie dollars, resource-sensitive sectors, including metals and materials, as well as commodity-sensitive emerging markets.
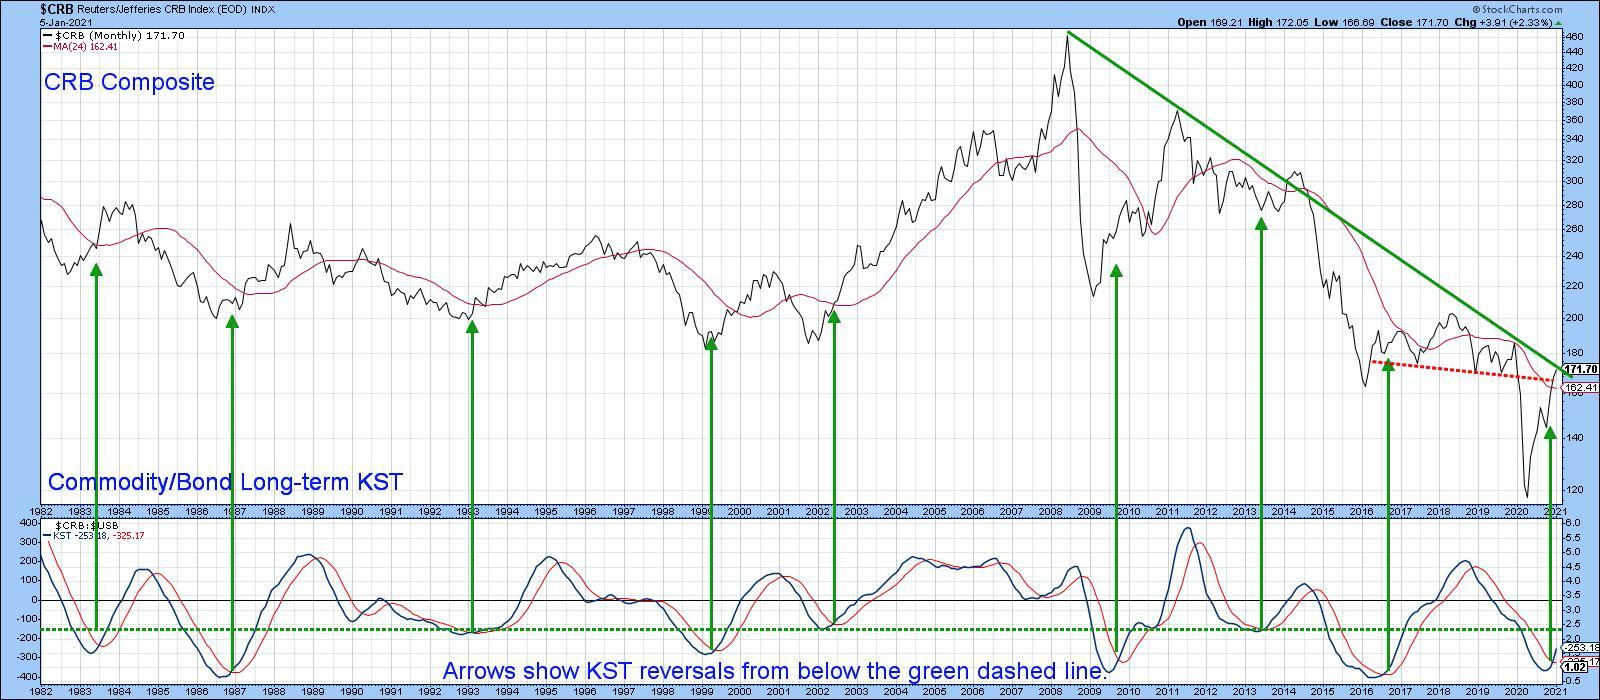 Chart 3
3. US versus the World
Another theme change that appears to be taking place is a reversal in the trend favoring US equities vis a vis the Dow Jones World Index. Chart 4 compares this relationship to its Special K indicator, which you can read about here. Basically, the Special K, which is calculated by adding short-, intermediate- and long-term KST momentum, triggers major buy and sell signals when it changes direction. This is best achieved when it crosses its signal line and a trendline greater than 9 months in length. Confirming action by the price being monitored is also required. Four examples are presented in the chart. A fifth has now been confirmed, as the ratio has violated its 2018-20 up trendline and 200-day MA and crossed below its signal line. Remember, this is a relative relationship and does not tell us that the US market will decline, merely that it is likely to underperform the world. In fact, both are likely to rally, but the US less so.
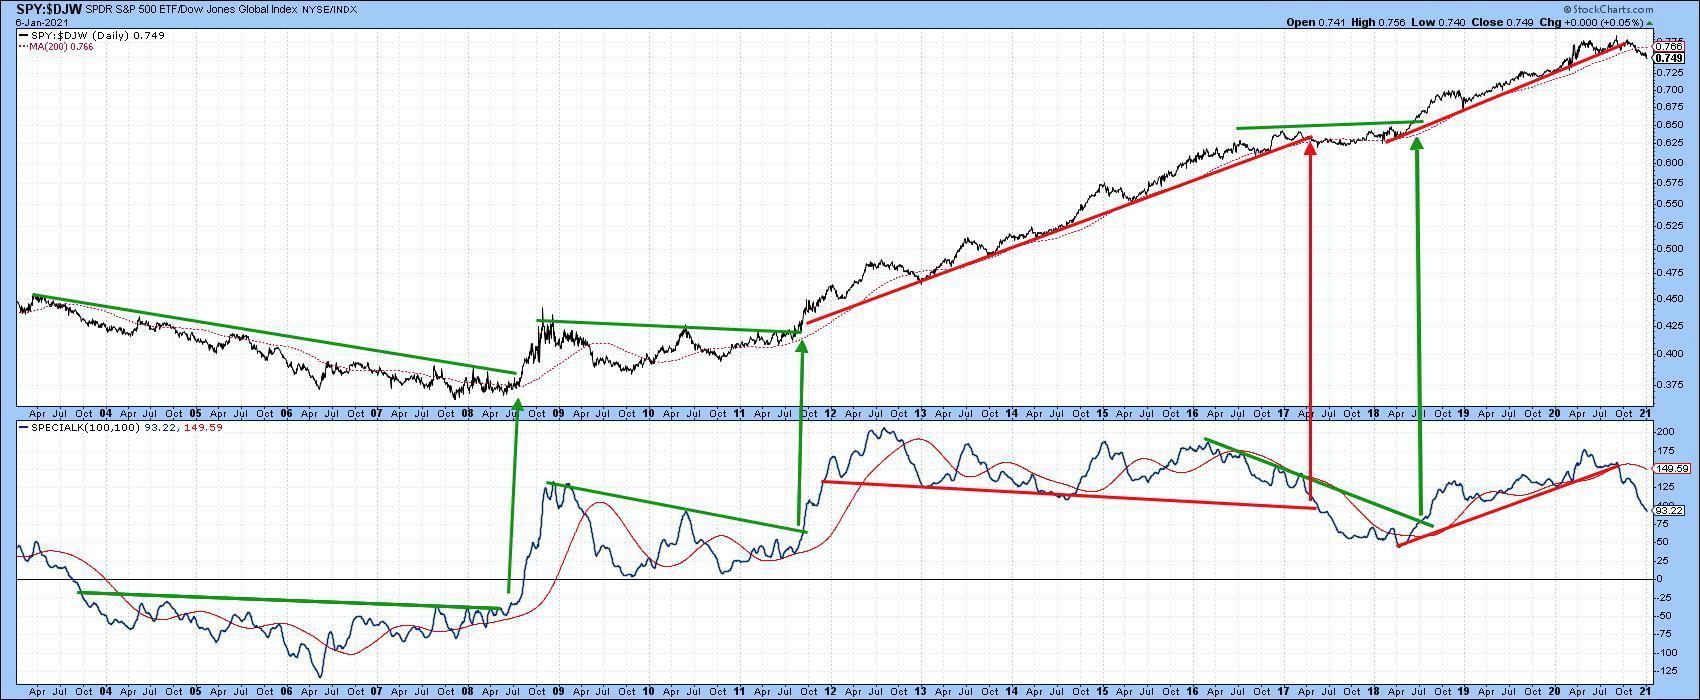 Chart 4
4. Growth versus Value
This relationship looks likely to reverse in favor of value. However, at this time, there is insufficient evidence to prove it. Chart 5 shows that the ratio has just crossed below its 200-day MA. It's certainly not a decisive signal, but needs close monitoring. That's because there has only been one false signal in the last four years. Also, this relationship is right at the neckline of a potential head-and-shoulders top. Since the short-term KST has started to tick over in sympathy with its intermediate counterpart, there is not much margin for error. It's premature to call a top at this point, especially as long-term momentum in the bottom window is still bullish, but it's certainly worth following to see how things turn out going forward. Remember, you can easily update this chart either by clicking on it as more data is available or saving it to a ChartList.
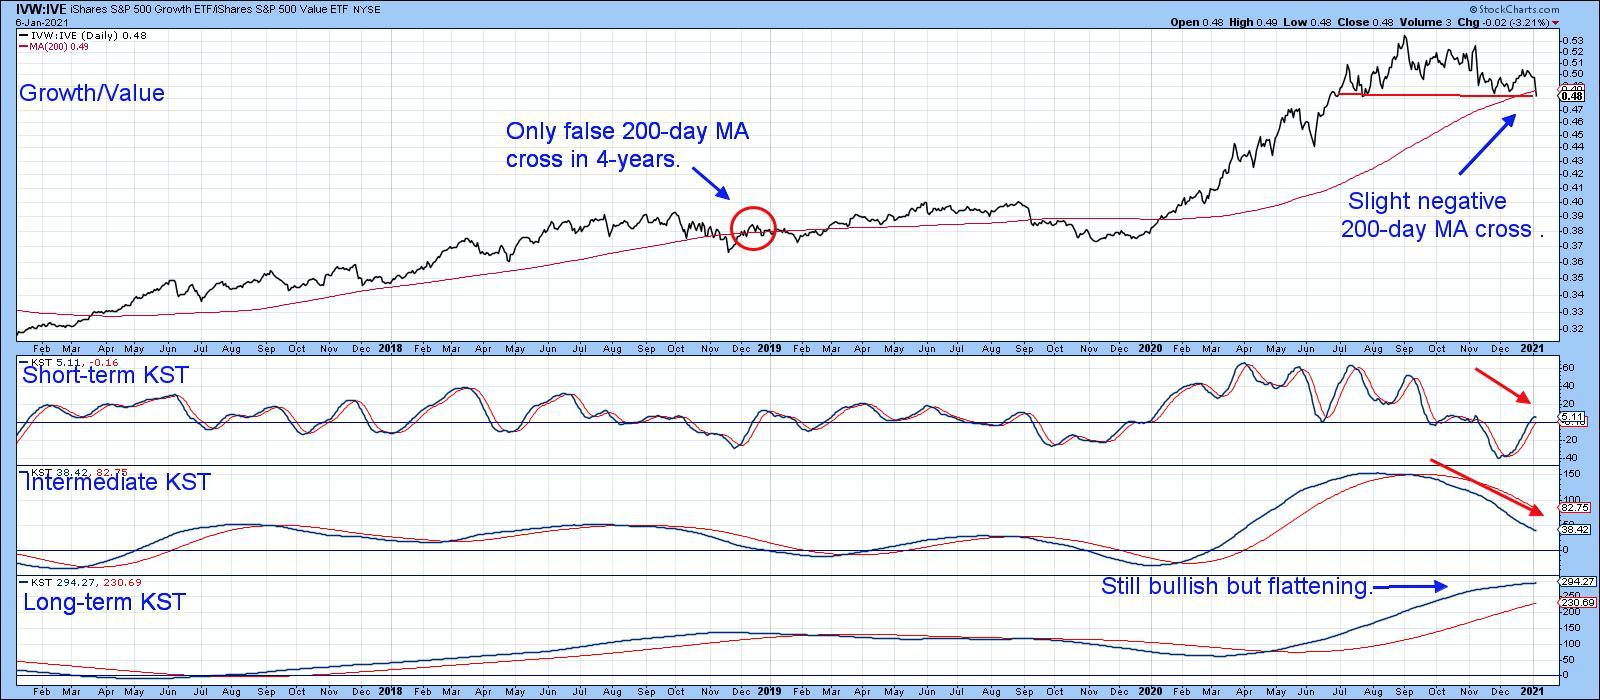 Chart 5
This article was originally published on Wednesday, January 6th at 5:40pm ET in the member-exclusive Martin Pring's Market Roundup blog.
Good luck and good charting,
Martin J. Pring
The views expressed in this article are those of the author and do not necessarily reflect the position or opinion of Pring Turner Capital Group of Walnut Creek or its affiliates.


