Stock indexes remain under pressure again today and are pressuring moving average lines. Chart 1 shows the Dow Industrials falling below its 50-day moving average for the first time since early November. It may be headed for a test of a potential support line drawn over its early September high. Chart 2 shows the S&P 500 in danger of falling below its 50-day line as well. Wednesday's message showed its daily MACD lines turning negative which warned of more selling to come. Its 14-day RSI line in the upper box has also fallen below its 50-day line which shows a weakening of momentum. It may be heading toward its early September high as well. Chart 3 shows the Nasdaq Composite Index falling below its 20-day average today. It appears headed for a test of its 50-day average (blue arrow). Its daily MACD lines have turned negative.
All eleven sectors are in the red today with the biggest losses in energy, technology, cyclicals, and industrials. Defensive stocks like utilities, REITS, and staples are holding up a little better.
Most of the week's media coverage has been concentrated on the casino type trading taking place in GameStop and a dozen other stocks, and the battle taking place between those heavily-shorted stocks held by hedge funds and new buying by retail investors pushing those stocks sharply higher. Some have suggested that type of trading is symptomatic of bubble-like conditions in the stock market. Others have suggested some forced selling by those hedge funds has contributed to this week's stock selling. It's hard to say whether any contagion between the two is actually taking place. But it seems safe to suggest that the casino-like conditions surrounding GameStop may be causing some of the short-term nervousness in the broader stock market.
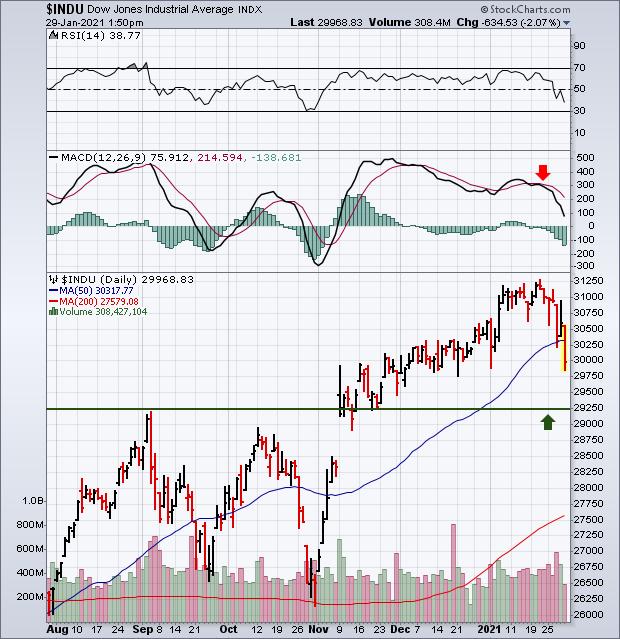 Chart 1
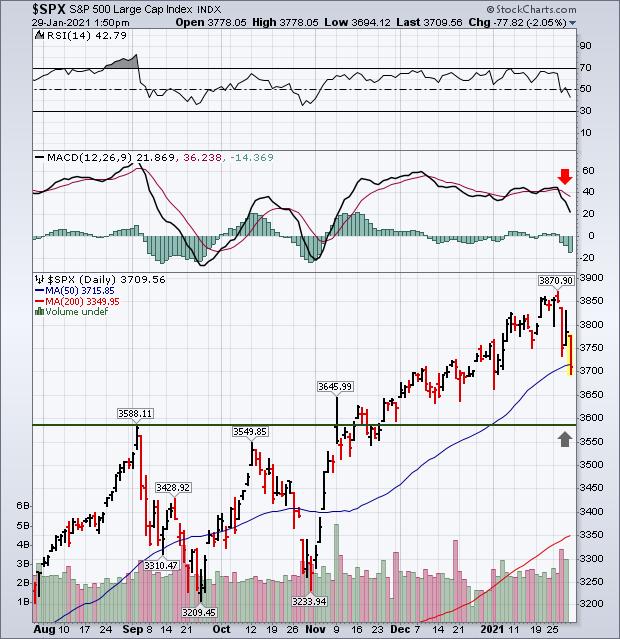 Chart 2
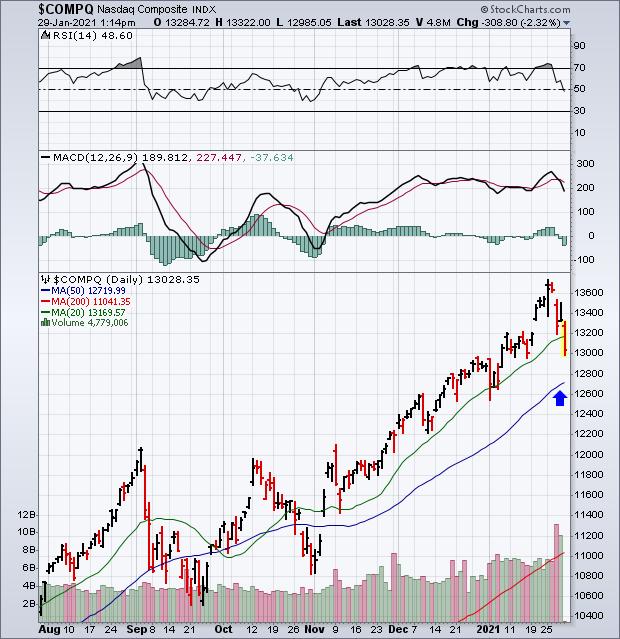 Chart 3
Editor's Note: This is an article that was originally published in John Murphy's Market Message on Friday, January 29th at 1:53pm ET.
