The seasonal patterns over the next two months are not very strong, but price action is strong with the S&P 500 hitting a new high. Price action is more important than the seasonal pattern because profits and losses are driven by price changes, not seasonal tendencies. Seasonality becomes a force when it aligns with price action. Let's investigate.
The chart below shows the seasonal patterns for the S&P 500 over the last twenty years (2001 to 2020). Note that I shifted the slider one year to the left to exclude 2021. Thus, data for January 2021 and February 2021 are not included.
Two months stick out like bulls on the beach: April and November. These two were by far the strongest months in the last twenty years. Both were up 80% of the time (16 of 20 years) and the average monthly gains were above 2%. Elsewhere, May and December were also strong as both showed gains 70% of the time.
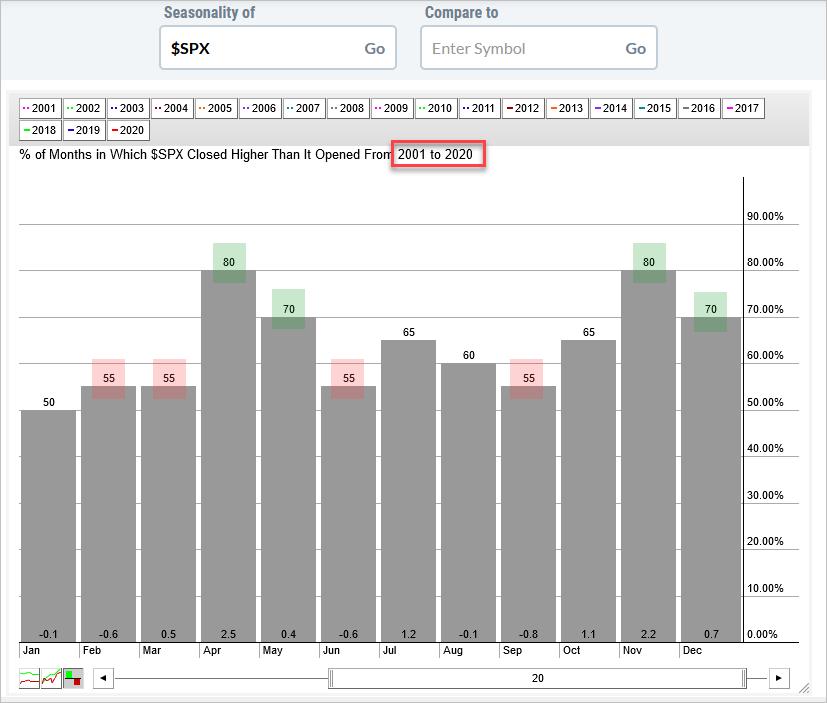
55% is the next number that stands out because four months showed gains 55% of the time (February, March, June and September). Of these four months, the average gain was actually a loss for three (February, March, and June).
At this stage, I do not have June on my mind. However, looking out over the next three months, the seasonal patterns show a 50/50 chance for a correction of some sort in February and/or March. Such a correction could make for a great buying opportunity with April around the corner.
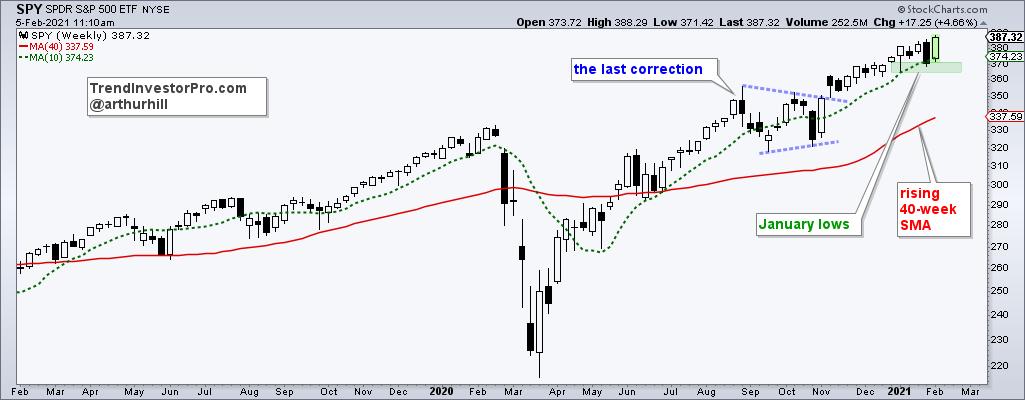
The price chart for SPY goes not confirm the seasonal pattern because the ETF hit a new high this week, as did QQQ and IWM. Thus, thoughts of a correction are on hold for now. With this week's big bounce, SPY established short-term support with the January lows. A break below these lows would show the most selling pressure since September and argue for a correction, especially with weak seasonality in February-March.
This week at TrendInvestorPro, I looked at seasonal patterns going back to 1950 and showed how these patterns can change by comparing two twenty year periods. I also looked at weekly seasonal patterns, the patterns for each month (beginning to end) and the first year after an election. Click here to subscribe and get immediate access to this report and more.
---------------------------------------------------
Choose a Strategy, Develop a Plan and Follow a Process
Arthur Hill, CMT
Chief Technical Strategist, TrendInvestorPro.com
Author, Define the Trend and Trade the Trend
Want to stay up to date with Arthur's latest market insights?
– Follow @ArthurHill on Twitter


