Tech-related ETFs are lagging over the last few weeks, but they are still in uptrends overall. This means bullish setups still matter so today we will look at a classic mean-reversion setup in the Software ETF (IGV).
The IGV setup came to light through the ETF Ranking, Trends and Setups table at TrendInvestorPro. This table tracks trend signals, mean-reversion setups, 52-week highs and more for the ETFs in our Core List (currently 118). The image below is a section of this table. The column on the right shows ETFs that became oversold at some point over the last five days, and there were quite a few with the pullback at yearend. The next column quantifies their 52-week range with 100 signaling a 52-week high and 0 a 52-week low.
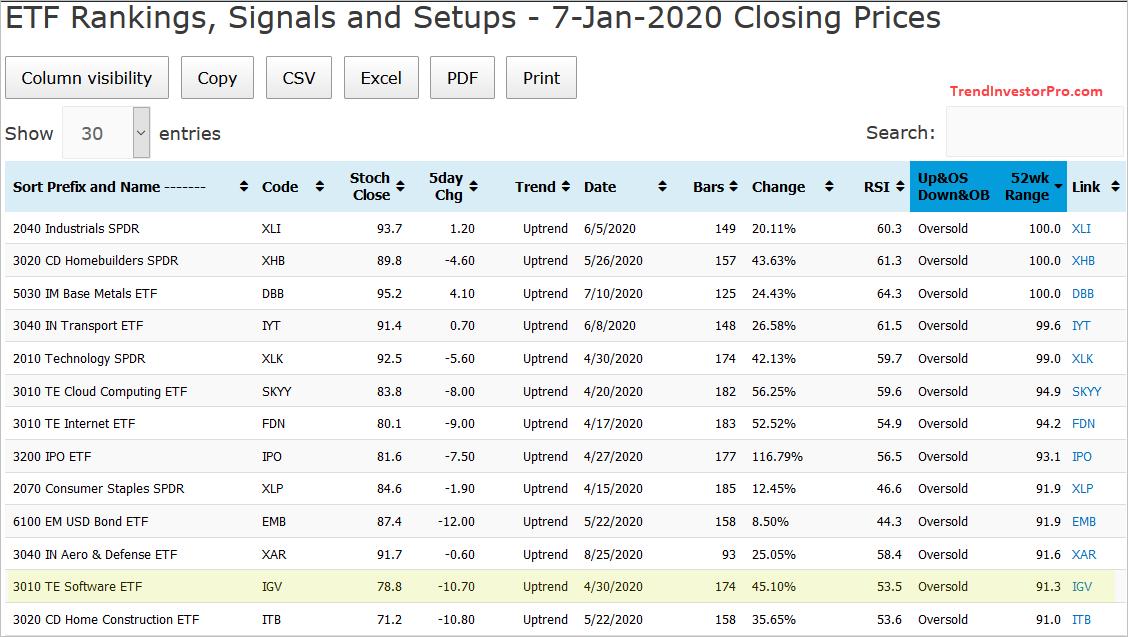
ETFs that are in uptrends and short-term oversold have possible mean-reversion setups and warrant further investigation (chart analysis). Some two dozen ETFs pulled back or consolidated recently and this created an number of mean-reversion opportunities as we started the year.
The chart below shows the Software ETF (IGV) as an example. First, notice that the Full Stochastic (125,5,1) has been bullish since it crossed above 60 in late April (uptrend). Second, IGV broke out in December and hit new highs at yearend. The big trend is clearly up and this means pullbacks are our friends (mean-reversion setups).
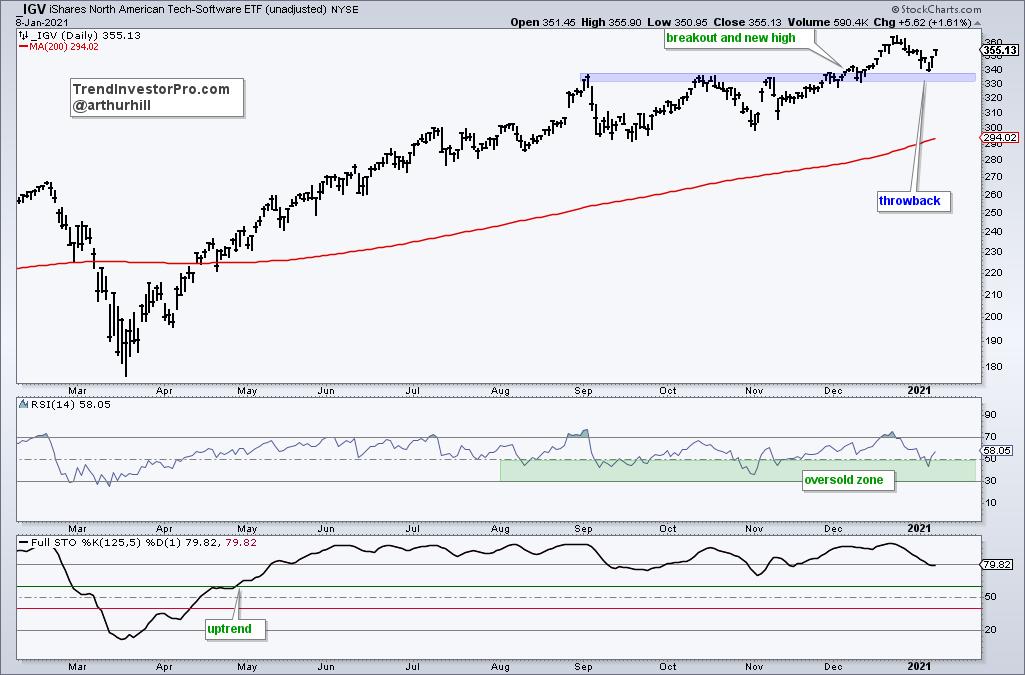
IGV pulled back and RSI(14) dipped into the 30-50 zone on January 6th. This RSI zone denotes a short-term oversold condition of varying degrees. RSI has since moved back above 50 and is no longer oversold. On the price chart, the breakout zone and former resistance area turn first support (blue zone). The decline back to the breakout zone is known as a throwback and the first area to watch for a bounce, which we are getting now.
The ETF Ranking, Trends and Setups table is updated every week at TrendInvestorPro.com. Signals derived from this table and suggested trading strategies are covered with detailed charts in our regular commentaries. Click here to learn more and get immediate access!
--------------------------------------------------
Choose a Strategy, Develop a Plan and Follow a Process
Arthur Hill, CMT
Chief Technical Strategist, TrendInvestorPro.com
Author, Define the Trend and Trade the Trend
Want to stay up to date with Arthur's latest market insights?
– Follow @ArthurHill on Twitter


