The radical waves in the economic cycle in 2020 look set to continue into 2021. Elon Musk has outpaced Jeff Bezos as the richest man in the world, which I would have never mapped out as a possibility. The chart of Tesla (TSLA) continues to surge higher. It like betting against Microsoft (MSFT) in the 1990s if you don't believe it can continue. The shorts continue to get squeezed.
But this article isn't about Tesla or electric cars. It is not about the 10% days of Bitcoin, day after day. It's about Gold, which has been unable to mount a serious rally, even in the face of a declining Dollar. While the Federal reserve and central banks everywhere have decided unbridled inflation would be good for a few years, Gold forgot to put together a rally on the news. I would say the table is set for the next breakout. If the breakout does not occur, this is a pretty serious place to watch.
First of all, on the top panel of the chart below, this would be the GLD ETF's third test trying to get through 185 since the August high. There is also an uptrend from the November 30th low that is being tested.
The second panel shows how many stocks are on a buy signal out of the group of major gold miners. Currently, that's just over 55%, with fewer stocks participating on each rally. That is definitely a concern.
The third panel is the Gold Miners ETF (GDX). While the GLD ETF (top panel) keeps returning to 185, the Gold Miners ETF price (third panel) continues to make lower highs. On each rally, the miners get less participation.
The last panel shows the ratio of the Gold Miners compared to the price of Gold. When the price of gold was rallying, the gold miners were as well. As the ratio was trending higher before August, this was helpful. Since then, it has been declining. At this point, this trend is friction for the move up. The good news is that this is the first time the ratio started to make a higher high since the August downtrend started.
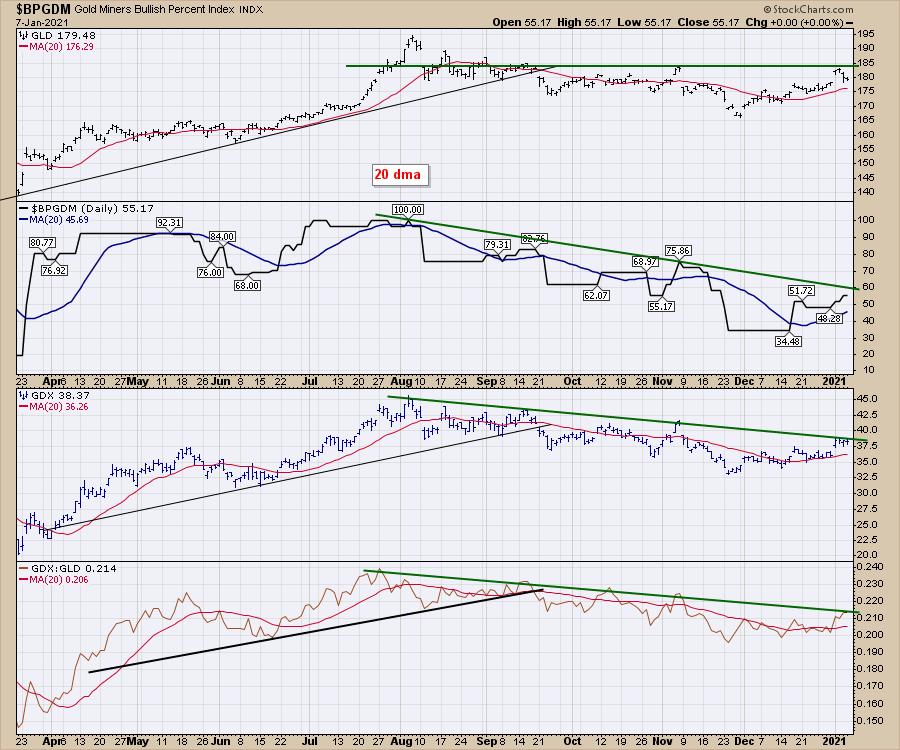
So how do we interpret this chart? As all the charts are up against their trend lines, this is the point of inflection. All four panels have moved back above the 20-day moving average, which is a start. If gold and the miners don't break out here, it is a very important sign. When the bullish precent index (Panel 2) stays below 50%, we are typically in a bigger down trend. That would change this from being the big rally through 2019 and 2020 to restarting another leg down. You don't want to be hanging around in these stocks if that is going to happen. We'll be watching GLD and GDX for more clues of where this is going to go!
It is an important signal for a host of other reasons, but we'll want to see this break through here! For more information on how this resolves, please head over to gregschnell.com and sign up for the articles. Follow this link to be kept abreast of the changing dynamic.
My presentation for StockCharts TV's Reflections 2020 event has been well received. Here is a a direct link to the video. The oil stocks are moving once again, and viewers of this video have a good feel for why this trade continues to work.
StockCharts Reflections 2020 Event
I will be presenting at the Wealth365 Summit in January. I plan on showcasing some more timely strategies for 2021 that will be different than the ones illustrated in this Reflections 2020 presentation. If you want to be one of the first to see this strategy for 2021, follow this link to register for the Wealth365 Summit.
I have been pointing followers into some of the huge movers in the fourth quarter. I had my largest month and largest year ever in a volatile year. Based on the feedback from subscribers of my work, they did too. It was a hard year and investors had a wide range of outcomes.
If you are interested in more of my suggestions, you can check out subscriptions at GregSchnell.com. As I mentioned in starting off this article, the radical waves in the economic cycle in 2020 look set to continue into 2021. Stay tuned for more ideas to help you beat the indexes!
Good trading,
Greg Schnell, CMT, MFTA
Senior Technical Analyst, StockCharts.com
Author, Stock Charts For Dummies
Want to stay on top of the market's latest intermarket signals?
– Follow @SchnellInvestor on Twitter
– Connect with Greg on LinkedIn
– Subscribe to The Canadian Technician
– Email at info@gregschnell.com


