The quarterly earnings that have poured out are utterly amazing. We're not just talking slight beats; Corporate America is CRUSHING it and the pent up demand hasn't even kicked in yet. In the meantime, the Fed is content to sit idly by with interest rates hovering near all-time lows. "Nirvana" might not be a strong enough term for what the bulls are feeling right now.
First, let's talk earnings. I keep a Strong Earnings ChartList (SECL), which we provide to our members every 1-2 weeks, as I update it. It involves many hours of researching the absolute best earnings reports, coupled with solid technical indicators. Our philosophy with regard to investing is unique, in that we combine both fundamentals and technicals - and it's definitely a winning combination. When I updated our SECL earlier today, our final list comprised 400 companies. Just for fun, I added up the current quarterly earnings per share (EPS) for all 400 companies. The total was $546.98. The total estimates collectively were $419.53. That's an "average earnings beat" of $127.45, or more than 30%!!!
When a company is beating estimates by a wide margin and raising its estimates, Wall Street has to go through the process of recalculating valuations. When these increases occur with interest rates near all-time lows, valuations go through the roof. This isn't rocket science. For CPAs and/or MBAs, these are fairly basic calculations once the variables are determined. The key variables are (1) earnings growth rates to predict future earnings and (2) interest rates used to discount those future earnings back to the present. In today's interest rate environment, you have to calculate what these future, rapidly-accelerating earnings are worth. This is the part that most of the stock market community simply doesn't understand. Wall Street is currently repricing those companies that are growing their earnings rapidly. It's not just that current earnings are 30% higher. These big earnings reports are changing future earnings growth rates. This has a tremendous multiplier effect. Those who don't understand today's valuations will really have difficulty a year or two from now after pent-up demand sends growth soaring in so many industries and individual companies.
I did a little study, because the stock market doesn't go up evenly throughout the year, or even throughout the quarter. History repeats itself, and Wall Street bids prices higher in anticipation of strong earnings - and then profit-taking hits that typically make even the most bullish investors a bit nervous. Let me explain by comparing historical returns during each calendar quarter. I wanted to see how the stock market performs during the first half of a quarter (during earnings season) vs. the second half of a quarter (just after earnings season). Here are the numbers (annualized returns) on the S&P 500 since 1950:
Quarter 1 (January 1 - March 31):
- 1st half of quarter (Jan 1 - Feb 15): +12.27%
- 2nd half of quarter (Feb 16 - Mar 31): +4.68%
Quarter 2 (April 1 - June 30):
- 1st half of quarter (Apr 1 - May 15): +14.32%
- 2nd half of quarter (May 16 - Jun 30): +1.52%
Quarter 3 (July 1 - September 30):
- 1st half of quarter (Jul 1 - Aug 15): +8.33%
- 2nd half of quarter (Aug 16 - Sep 30): -2.74%
Quarter 4 (October 1 - December 31):
- 1st half of quarter (Oct 1 - Nov 15): +14.44%
- 2nd half of quarter (Nov 16 - Dec 31): +17.67%
Quarter 4 is the most bullish quarter of the year, as I've posted on many occasions. The first half of the quarter vs. the second half of the quarter doesn't work for Quarter 4, as December is a very solid month for equities. Both halves of Quarter 4 are extremely bullish.
But look at the other 3 quarters. All of them show much more bullishness during the first half of the quarter than during the second half. I think it's important to mention this because Monday is February 15th. While I believe prices will go higher from February 15th through March 31st, we should temper our expectations based on history. We'll need a period of consolidation and the upcoming six-week period is as good a time as any.
This is Road Block #1.
Road Block #2 deals with monthly options expiration. When the masses are loading up on call options, we need to be vigilant about taking profits in stock trades, especially those stocks that are in significant uptrends and are heavily traded in options. Check out this chart of the equity-only put call ratio ($CPCE) and the S&P 500 in the panel below:
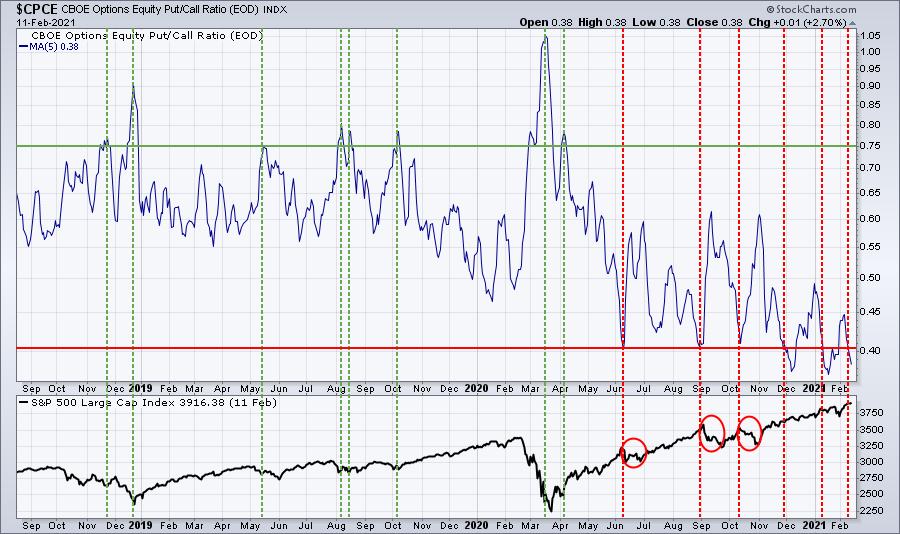
The put call ratio in the top part of the chart is a 5 day moving average. When we've seen that 5-day moving average dip to 0.4 or below, we've seen weakness multiple times (red circles). Market makers have financial incentive to drive prices lower. The past couple months there hasn't been as much of an impact, but it's not like prices went flying higher after these low put call readings. We've basically worked our way through earnings season and we've had a nice run. I believe we'll be higher on March 31st than we are now, but I wouldn't be surprised to see us stagger there given the above chart. We also know from my earlier research that the February 15th to March 31st period is historically much weaker than the preceding 6-week period.
Don't be afraid to book some profits here and raise some cash. Pullbacks will present tremendous opportunities, as this secular bull market remains in the very early innings. If you need a reminder of what a secular bull market looks like, here it is:
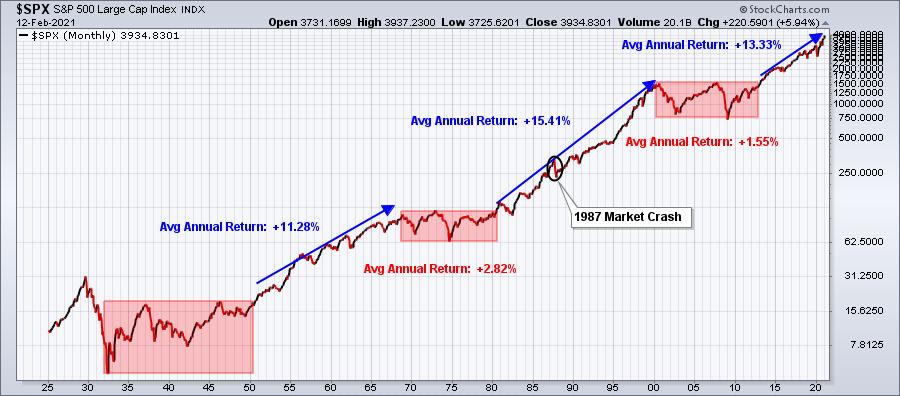
I believe the current secular bull market lasts through the balance of this decade, possibly longer. Let me emphasize that if you're looking 2 years, 5 years, or 10 years down the road, I would NOT change a thing. I'd stay long and ride this secular bull market, including the hiccups along the way. But if you're a short-term trader, then protecting recent profits makes sense as head towards another week of options expiration.
Our next "Stock Market Draft" will be held in a little more than a week. That's when we'll line all of our portfolios with leading stocks in leading industries for the next 90 days. I absolutely LOVE dozens of stocks for next quarter, but I'll make my final decisions after next week's trading. One week before this MAJOR event, we have a Sneak Preview Event to discuss the last quarter's performance, our methodology, key themes, and such. It's an opportunity for everyone to gain a better understanding to our approach at EarningsBeats.com as it's a free public event. Our results have been remarkable and we'd love to have you join us for the Sneak Preview event on Monday, February 15th at 4:30pm ET. For more information and to register (it's FREE), CLICK HERE.
Happy trading!
Tom Bowley, Chief Market Strategist
EarningsBeats.com
"Better Timing. Better Trades."


