They say that a rising tide lifts all boats, and so it is with freely traded markets. In the boating world, you can spot a rising tide with a steadily rising boat, but, with markets, the simplest approach is to observe a series of rising peaks and troughs. However, there is another way in which it's possible to observe subtle clues as too the direction of the main trend, which is by observing momentum characteristics. This article will focus on a 9-day RSI, as applied to current market conditions, but other oscillators, such as ROC, could also be used. The principles are the same. I like using the RSI for this particular exercise because its calculation allows you to compare the performance of different securities using a common standard. Moreover, since the RSI returns a series that cannot move above 100 or below zero, it's possible to assign overbought/oversold zones to specific levels for all securities.
There is one more point to make before examining the current position of three markets. These characteristics represent just one piece of evidence in our weight-of-the-evidence approach to trend analysis. It's only one piece because this technique, like all others, is no holy grail, and it fails from time to time.
Bull and Bear Market Characteristics
It's a well-known rule in technical analysis that markets are very sensitive to oversold conditions when the primary trend is positive. It's rather like putting your hand accidentally on a hot stove - touching it causes it to automatically pull away quickly. By the same token, overbought conditions in a bull market are far more plentiful and do not have anywhere near the downside power that they do in a bear market. Another bull market characteristic is that oscillators can remain in an overbought state for an extended period without the usual adverse effect on the price.
When the direction of the primary trend is down, things are reversed in that prices are extremely sensitive to overbought conditions, which themselves tend to be quite rare. That's rather like jumping up to the ceiling and hitting your head against it. The power of the main trend, gravity, pushes you down pretty quickly. In a bear market, oversold conditions are generally followed by trading ranges or weak/non-existent rallies. Let's take a look at some current charts to see some of these points demonstrated.
Chart 1, featuring the S&P, offers a great example. In the May to September 2020 period, the RSI was characterized by two things. First, overbought readings were generally high. Second, the blue shading reminds us that these overbought readings were persistent. Both are signs of a vibrant primary bull market, as is the fact that there were no oversold conditions generated during this period. Between September and November, as a sideways intermediate correction took place, we had two "hot stove" oversold bounces, as flagged by the two green arrows. Since last late last year, the RSI failed to reach the levels of intensity experienced prior to November, nor did the plethora of overbought conditions trigger anything meaningful on the downside. My conclusion is that this analysis continues to signal the all-clear for the bull market. That's backed up by many long-term indicators, especially by the S&P relative to its 12-month MA.
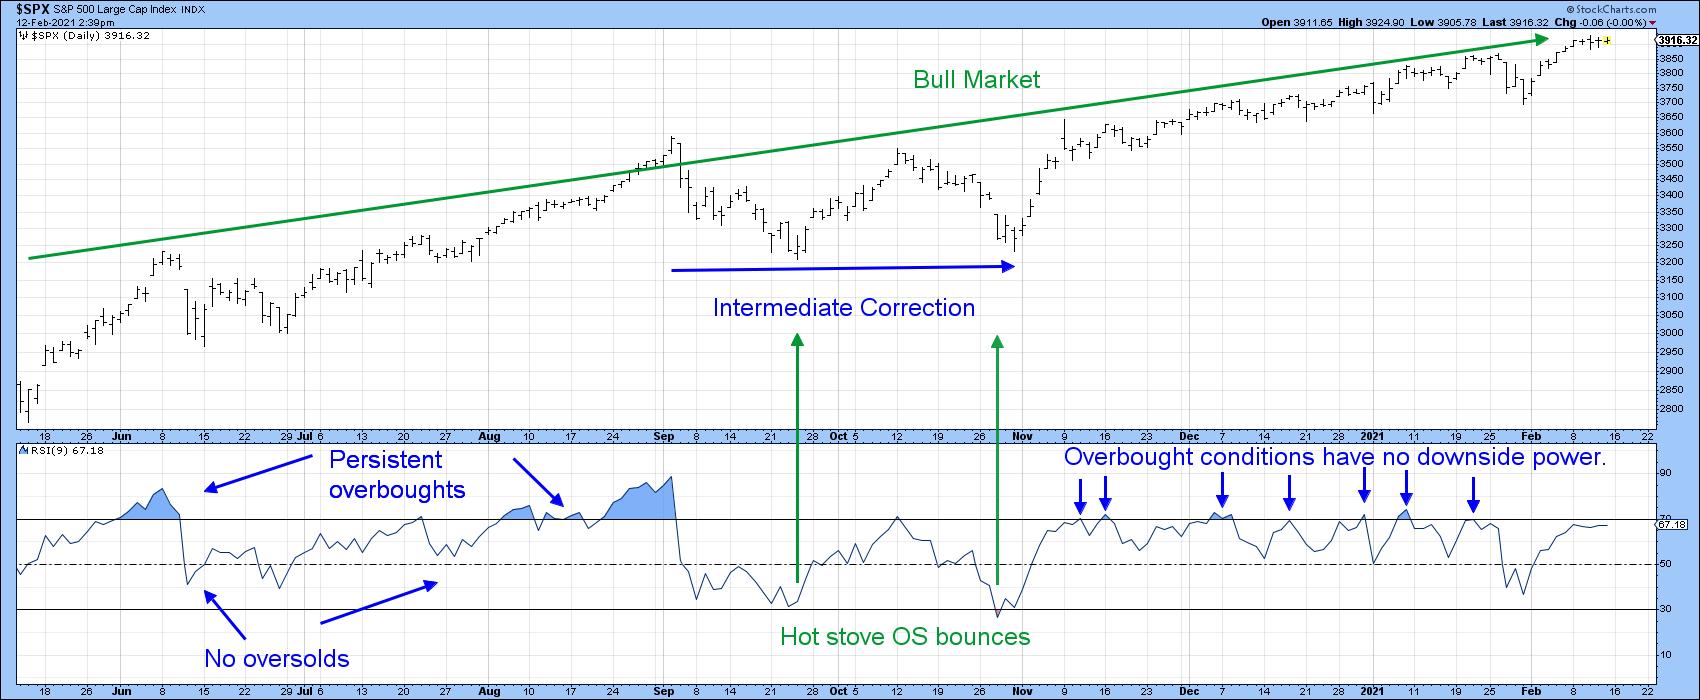 Chart 1
Chart 2, featuring bonds, tells us a different story, as we see a transition from primary bull to primary bear. June to March 2019-2020 was a clear-cut bull market with hot stove bounces and persistent overbought situations. This is then followed by a transitional period, where an oversold bounce in June is followed by a small persistent overbought condition. At that point, there was no indication from RSI characteristics that a bear market was likely to begin. However, by late October, a pattern of weak rallies following oversold conditions hinted at a bear. That pattern has continued since, thereby making it possible to construct a channel in which the RSI bear market trading range is below that of the bull market. Adding to the bearish characteristics was a persistent oversold, as recorded earlier this year.
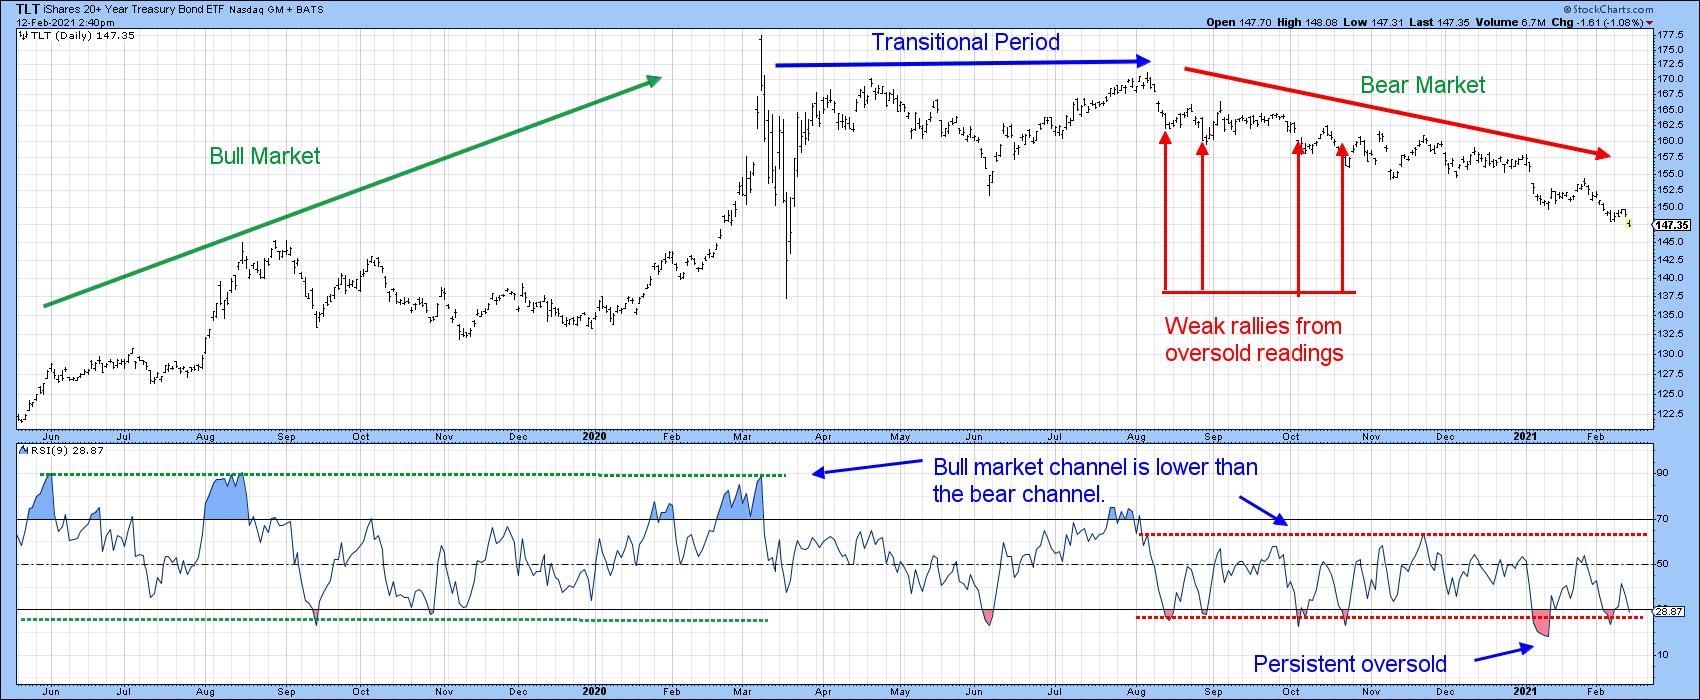 Chart 2
Chart 3 tells us we are on the right track, since two long-term indicators point in a primary bear market direction. That's the MACD dropping below its signal line and the price itself penetrating its 12-month MA. It's important to note that none of this guarantees a bear market, as there are no guarantees in technical analysis. However, it does place the odds strongly in favor of one.
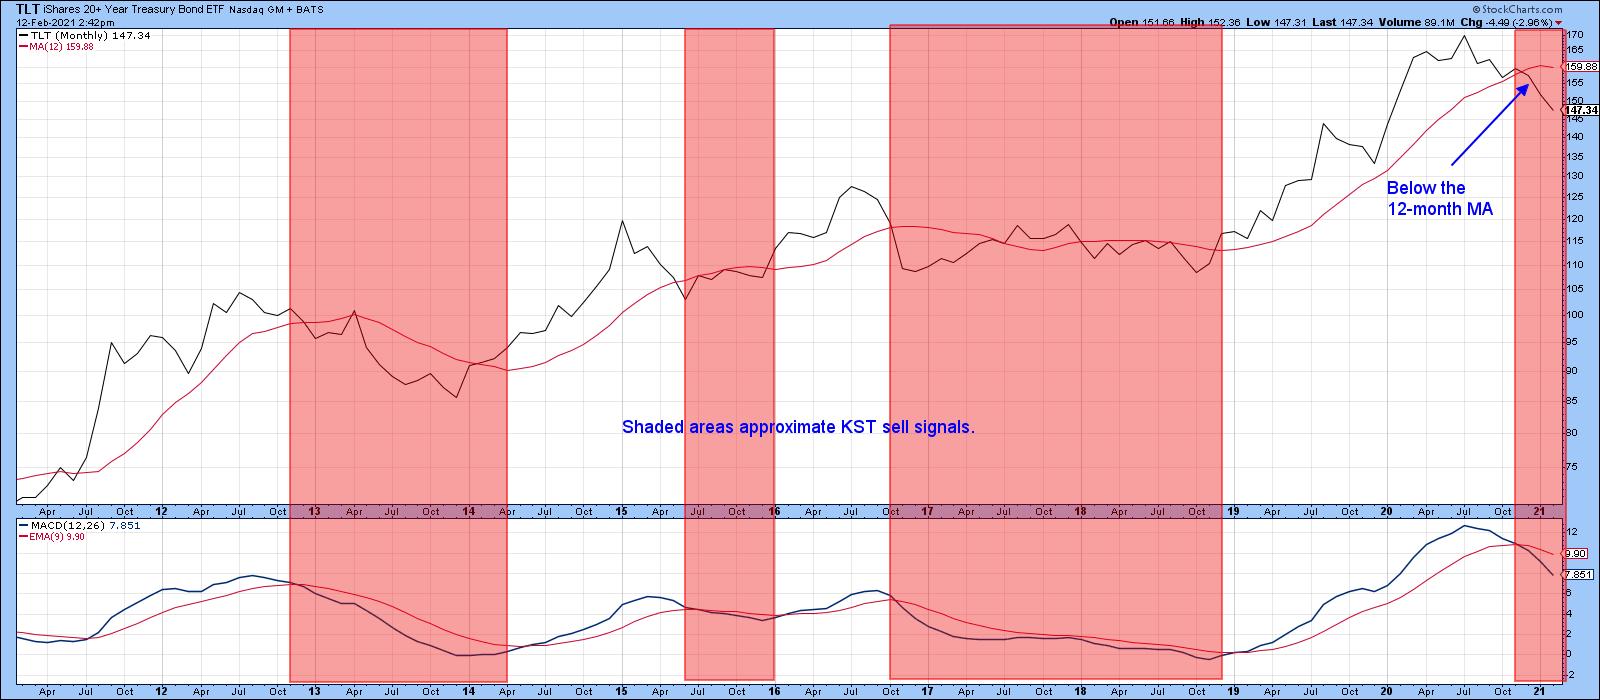 Chart 3
Finally, Chart 4 also offers us some more alternating bull and bear characteristics, but this time for the US Dollar Index. The first thing to note are the three arrows demonstrating the bull characteristic of a hot stove bounce from an oversold reading. We can also see the demarcation between the higher trading channel during the course of the bull market that ended last spring and the lower one reflecting the bear period since. One early hint that the trend had changed at the actual bull market high came from the RSI, which responded extremely quickly to two regular overstretched readings instead of experiencing a higher reading in excess of 70. Later on, in June, it became clearer that the tide may have turned, as the failure of the RSI to record an overbought reading was confirmed by a persistent oversold one.
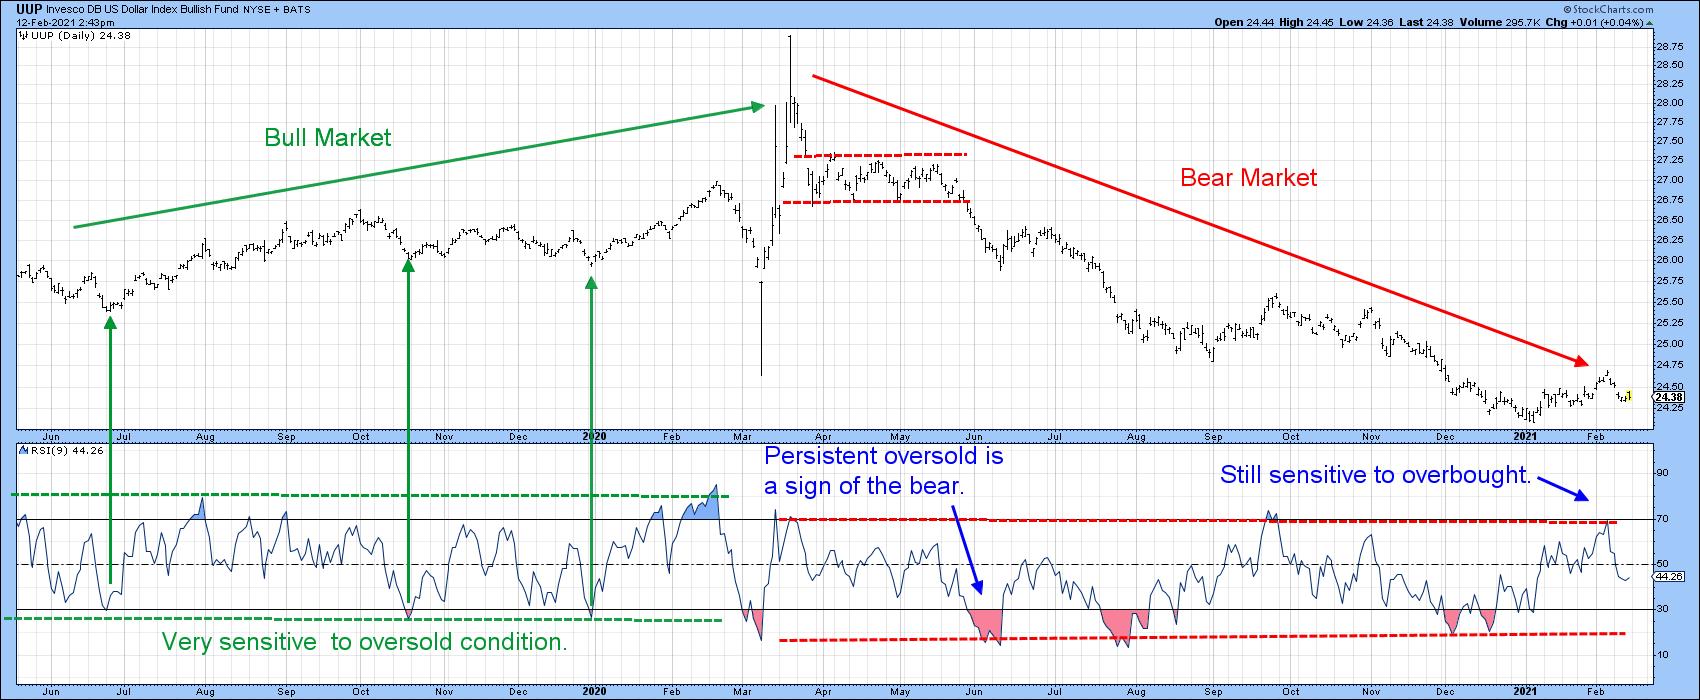 Chart 4
Most recently, the price has broken out from a small base in a similar way to late September's breakout. If the bear market is still in force, then the latest overbought reading should have failed. That's exactly what happened. It therefore meets two bear market characteristics - a failed pattern breakout, now confirmed by a double trendline break, and a quick response to an overbought reading with a decline. If the situation is to be saved, the price would need to take out out last week's high and register a stronger overbought reading. Such action would be the first sign that the price had begun a bull market. Unfortunately for the dollar bulls, it appears that we have another failed pattern, and that's certainly not encouraging.
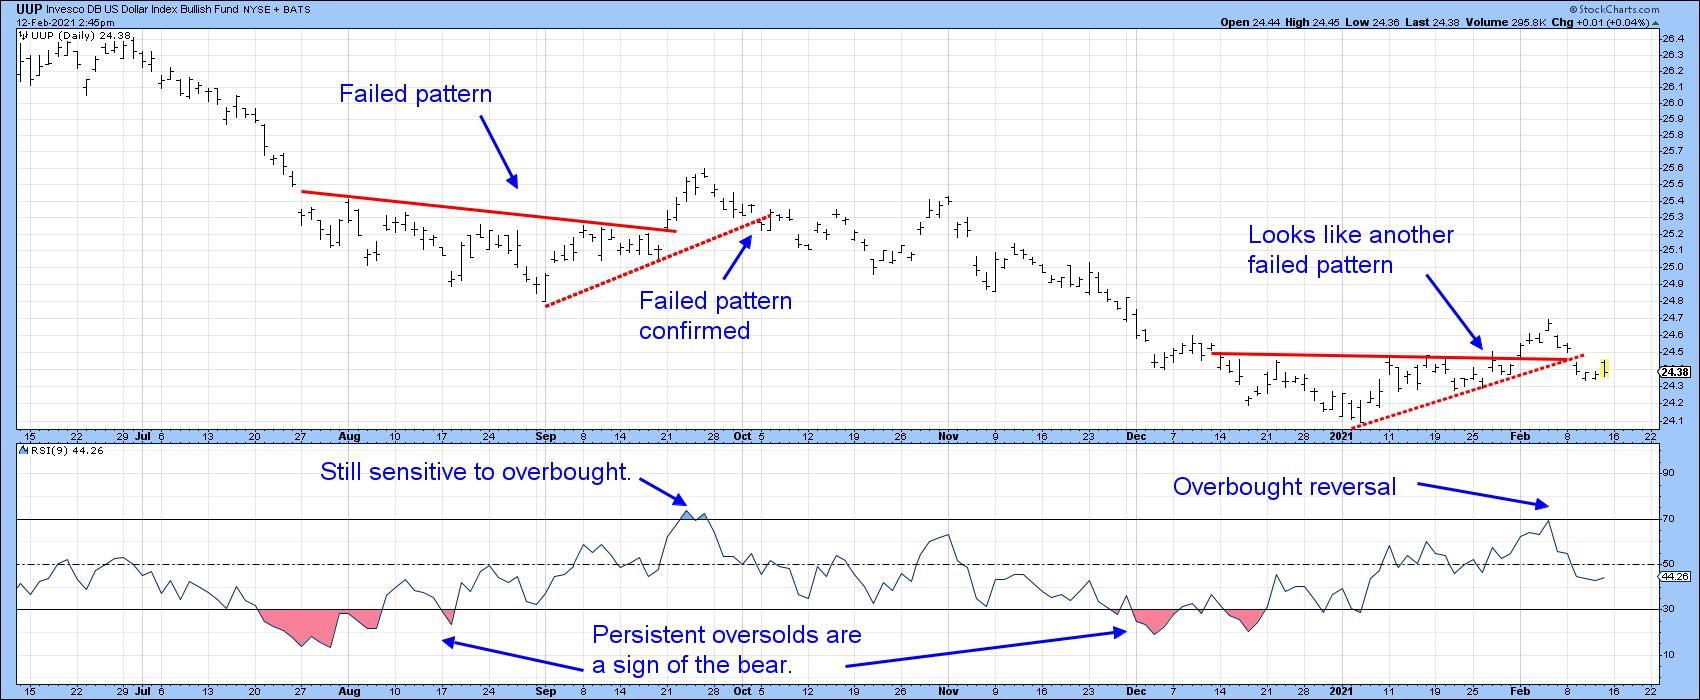 Chart 5
This is an updated version of an article previously published on Monday, February 8th at 4:35pm ET in the member-exclusive blog Martin Pring's Market Roundup.
Good luck and good charting,
Martin J. Pring
The views expressed in this article are those of the author and do not necessarily reflect the position or opinion of Pring Turner Capital Group of Walnut Creek or its affiliates.


