Semiconductors are outperforming the market, but not all Semiconductors are enjoying the strong rally that's been ongoing since September. Some of the more popular names have underperformed within their industry group and against the SPX. However, two are outshining the rest and have room to move higher.
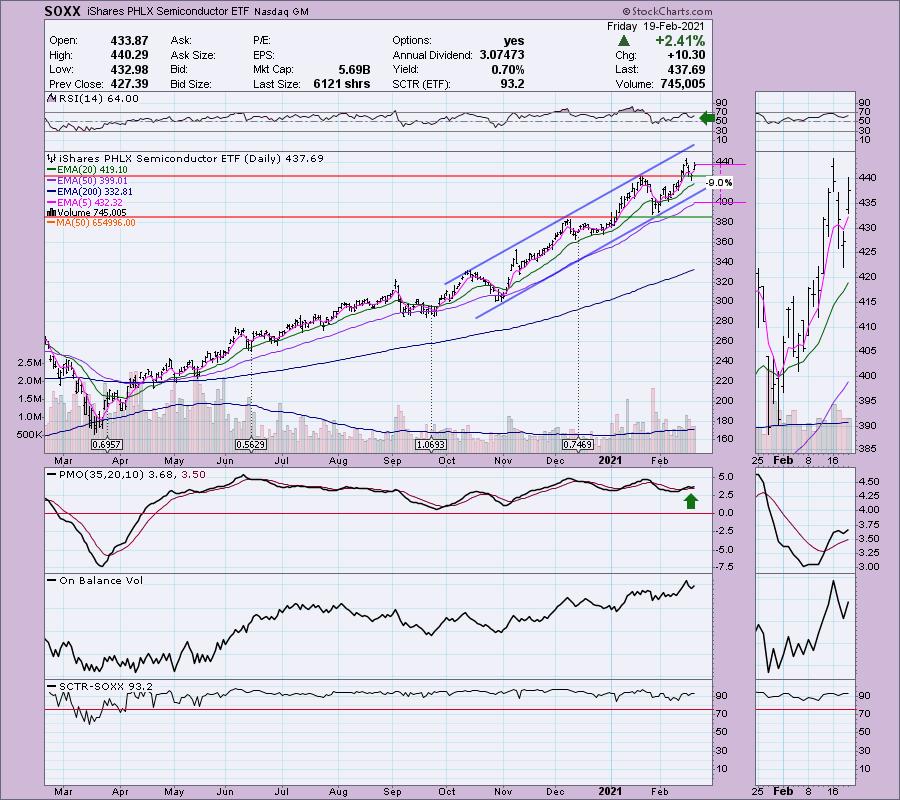
Looking at SOXX, the Semiconductor ETF, you can see a strong rising trend channel. After pulling back this week, they are now on their way back up. The PMO had topped, but now we have a bottom above the signal line.
IN JUST 10 MINUTES, EVERYTHING YOU NEED TO KNOW!
The DP Alert is the perfect primer to end every market day. In 10 minutes or less, you can read the daily DP Alert and know where the market is headed in the short- and intermediate-terms. You also get a review of Dollar, Gold, Gold Miners, Crude Oil and Bonds DAILY! We review the same charts to give you context and continuity, with interesting additions to complement the analysis for the day. Each report is easy to read and understand regardless of your level of experience.
SUBSCRIBE TO OUR BUNDLE TODAY and get one free week using this coupon code: DPTRIALCW. That is a $20 value for free!

Below are the two Semiconductors that are well known. One is a clear outperformer; the other I'd steer clear of.
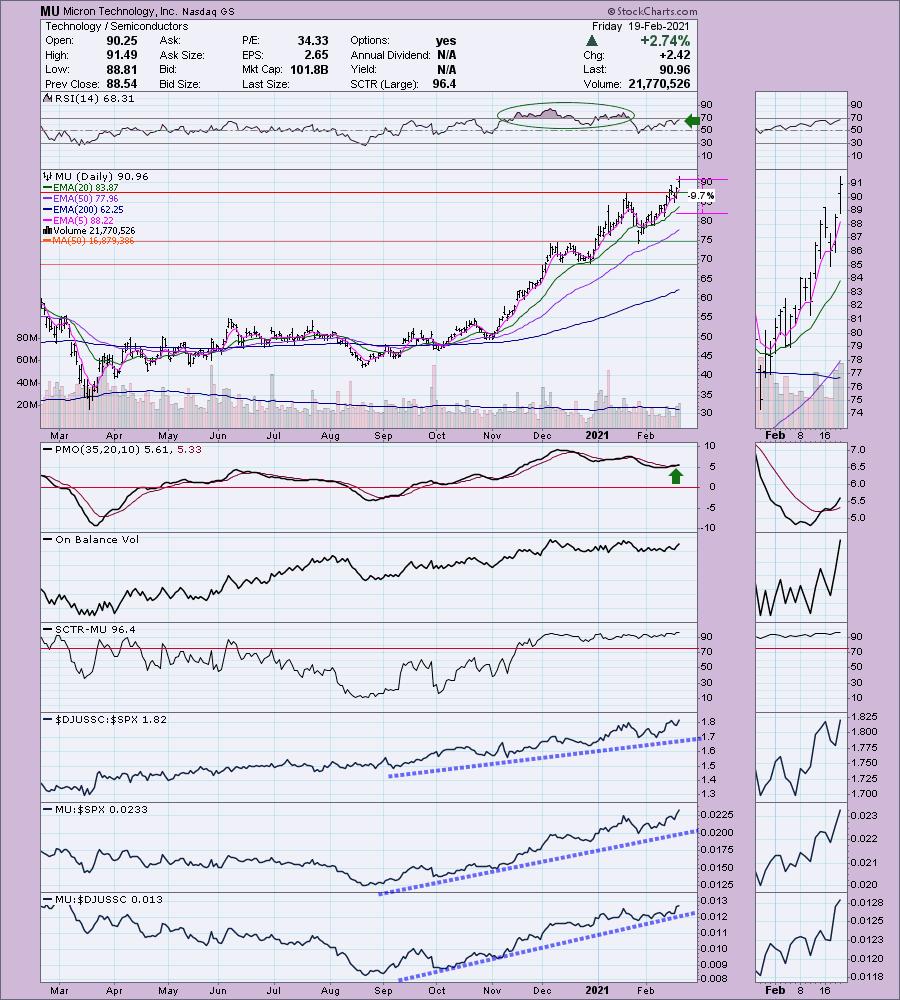
The outperformer is Micron Technology Inc (MU). Price broke out again. The RSI is positive and not that overbought. However, if it becomes overbought, we can see that the RSI can stay overbought for some time. The PMO is on a crossover BUY signal and has bottomed above the signal, which is especially bullish. The SCTR has been in the "hot zone" above 75 since mid-November. A SCTR ranking of 75 or above implies internal and relative strength, given the stock is considered in the upper quartile of its universe (in this case, the universe is large-caps). I put a stop level on it that would put price below the 20-EMA. With the market acting toppy, it is a good idea to have a stop in place.
Now look at the final three indicator windows. The first one shows us that Semiconductors have been outperforming the market since the September low. The second window shows that MU has been a clear outperformer against the SPX. The third window tells us this is a very strong selection within that industry group, given that MU has been outperforming its industry group by a mile since September.
Free DecisionPoint Trading Room on Mondays, Noon ET

David Keller, CMT, Chief Technical Analyst at StockCharts.com, will be joining Erin in the free DP Trading Room on March 1st! Dave will give us his take on the market and share his trading methodologies as both of us discuss your symbol requests.

David Keller, CMT is Chief Market Strategist at StockCharts.com, where he helps investors minimize behavioral biases through technical analysis. He is a frequent host on StockCharts TV and he relates mindfulness techniques to investor decision making in his blog, The Mindful Investor. David is also President and Chief Strategist at Sierra Alpha Research LLC, a boutique investment research firm focused on managing risk through market awareness. He combines the strengths of technical analysis, behavioral finance and data visualization to identify investment opportunities and enrich relationships between advisors and clients.
*Click here to register for this recurring free DecisionPoint Trading Room on Mondays at Noon ET!*
ALL REGISTRANTS RECEIVE A COPY OF THE RECORDING AT THE END OF THE DAY
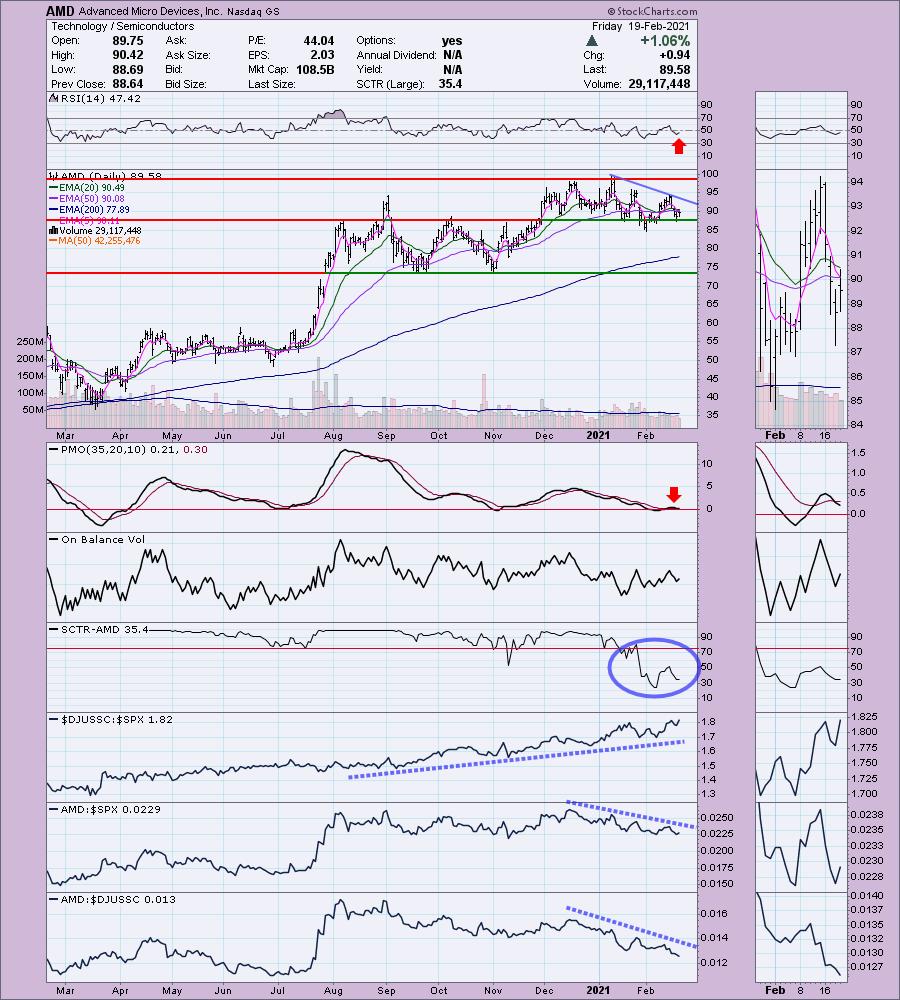
Now let's look at the other famous Semiconductor, Advanced Micro Devices (AMD). It is currently in a declining trend. The RSI is negative, while the PMO has topped and is on a SELL signal. Notice the terrible performance of AMD relative to the SPX and, more importantly, relative to the other Semiconductors.
Conclusion: Relative performance can help you select the strongest performers within a strong (or weak) industry group. Just remember, if the industry group as a whole is not outperforming, your confidence level should be lower even if your stock is outperforming within the industry group. Think of it this way - a stock could be in decline and still show strong relative performance to its brethren, simply because it is falling at a slower rate.
Happy Charting! - Erin
Technical Analysis is a windsock, not a crystal ball.
Helpful DecisionPoint Links:
DecisionPoint Alert Chart List
DecisionPoint Golden Cross/Silver Cross Index Chart List
DecisionPoint Sector Chart List
Price Momentum Oscillator (PMO)
Swenlin Trading Oscillators (STO-B and STO-V)
DecisionPoint is not a registered investment advisor. Investment and trading decisions are solely your responsibility. DecisionPoint newsletters, blogs or website materials should NOT be interpreted as a recommendation or solicitation to buy or sell any security or to take any specific action.


