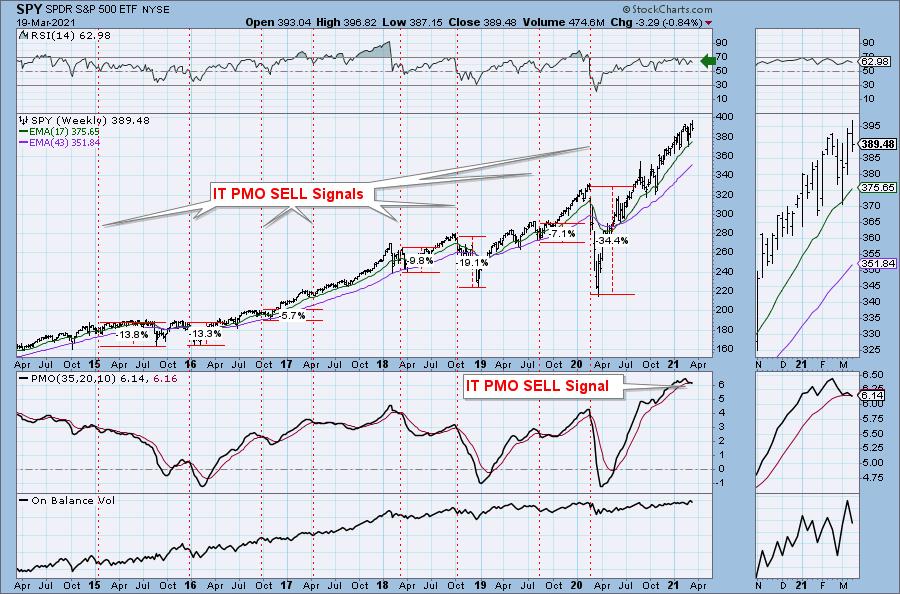
Today, the weekly PMO crossed below its signal line, which hasn't occurred since the early 2020 bull market top. The chart isn't all bad given the positive RSI and rising OBV. However, this signal should be heeded; they don't happen often and they usually lead to sustained declines.
Admittedly, in a strong bull market, these signals haven't hurt the market gravely. Given the strong bullish bias in the market currently and the positive RSI, this may not lead to another bear market, but a pullback or possible correction are likely.
At issue is the health of our other indicators. Readers of the DPA know the many problems on the DecisionPoint indicators, from overbought to negative divergences; the indicators tell us to beware this new IT PMO SELL signal. However, this isn't the only warning sign we got this week....
DPA: Clear and Concise Daily Market Commentary

DP Diamonds: Easy-to-Understand Stock Analysis
Try us out for a week! Subscribe to the Bundle and use coupon code: DPTRIAL. You'll find all of our reports going back to October 2019. Review our commentary and "diamond in the rough" picks that go back to before the 2020 bear market and enjoy the quality commentary from Carl and Erin Swenlin.
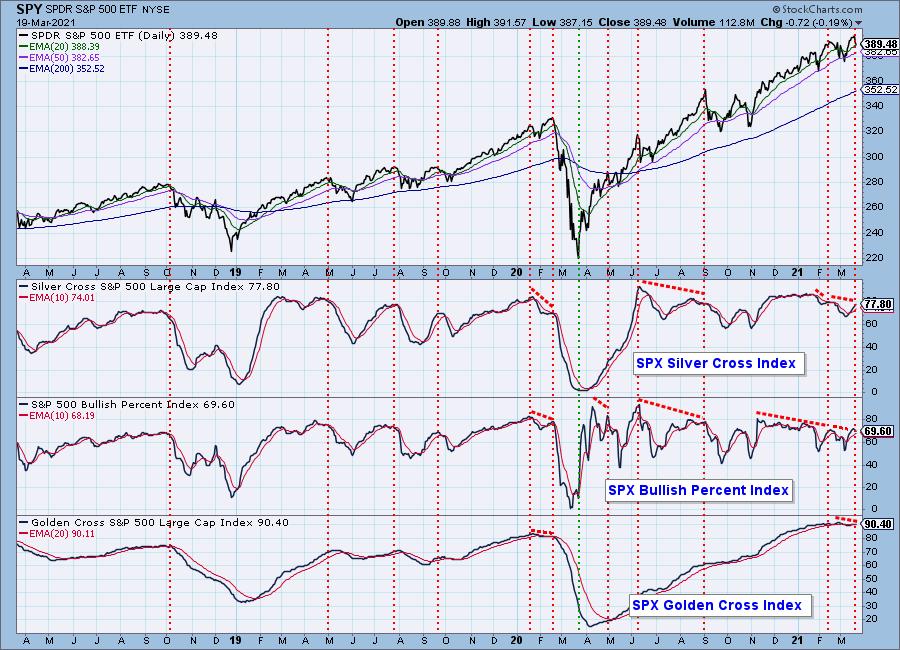
The weekly PMO SELL signal is an intermediate-term warning; however, we had a long-term warning this week on our Golden Cross Index. The Golden Cross Index (GCI) shows the percentage of SPX stocks on LT Trend Model BUY signals (50-EMA > 200-EMA). This week, the GCI set a lower top, which set up a negative divergence. Like the weekly PMO SELL signal, this GCI negative divergence hasn't been seen since the beginning of the bear market.
Free DecisionPoint Trading Room Every Monday!

Click here to register in advance for the recurring free DecisionPoint Trading Room! Recordings are available!
CONCLUSION: Carl pointed out two significant short-term negative divergences last week in his article, "Keeping it Simple". Now we have intermediate- and long-term warning signals in the form of a weekly PMO SELL signal and a negative divergence on the Golden Cross Index. Be prepared for more downside ahead.
Happy Charting! - Erin Swenlin
Technical Analysis is a windsock, not a crystal ball.
Helpful DecisionPoint Links:
DecisionPoint Alert Chart List
DecisionPoint Golden Cross/Silver Cross Index Chart List
DecisionPoint Sector Chart List
Price Momentum Oscillator (PMO)
Swenlin Trading Oscillators (STO-B and STO-V)
DecisionPoint is not a registered investment advisor. Investment and trading decisions are solely your responsibility. DecisionPoint newsletters, blogs or website materials should NOT be interpreted as a recommendation or solicitation to buy or sell any security or to take any specific action.


