The DB Base Metals ETF (DBB) is breaking out of a bullish continuation pattern after a Bollinger Band squeeze and this signals a continuation of the long-term uptrend.
The first chart shows the DB Base Metals ETF (DBB) with Heikin-Ashi candlesticks in the top window and normal candlesticks in the lower window. Price action is quite "gappy" on the normal candlestick chart and this makes it harder to see developing patterns. Heikin-Ashi candlesticks remove these gaps by combining price points from two periods to create one candlestick. The formula is shown on the chart.
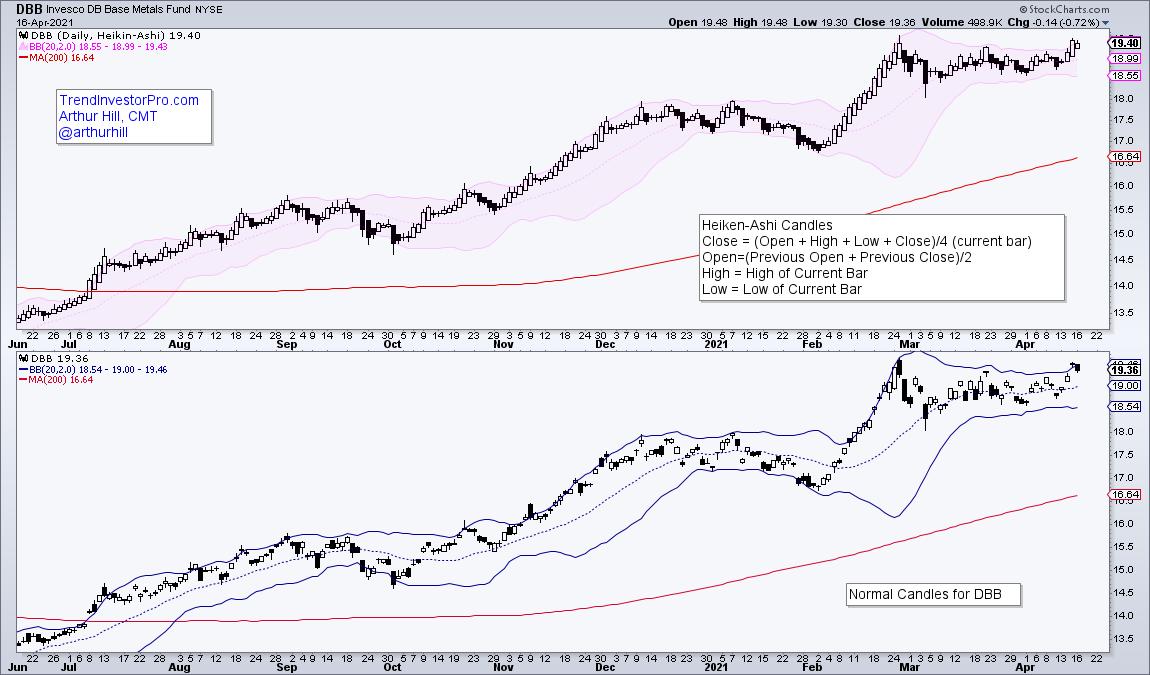
I suspect that DBB is "gappy" because it is based on three commodities in equal weights (copper, aluminum, zinc). Commodities trade 24/7 across the globe and this means DBB is reacting to price action that has already occurred when it opens. Also note that the Bollinger Band values are slightly different (1 cent). This is because the Heikin-Ashi close is different from the normal close.
Now let's get down to the analysis. First and foremost, the long-term trend is up. DBB is above its rising 200-day SMA and the ETF has been hitting 52-week highs on a regular basis since September. Note that I am only interested in short-term bullish setups and signals when the long-term trend is up. Short-term bearish setups and signals are a waste of time in uptrends.
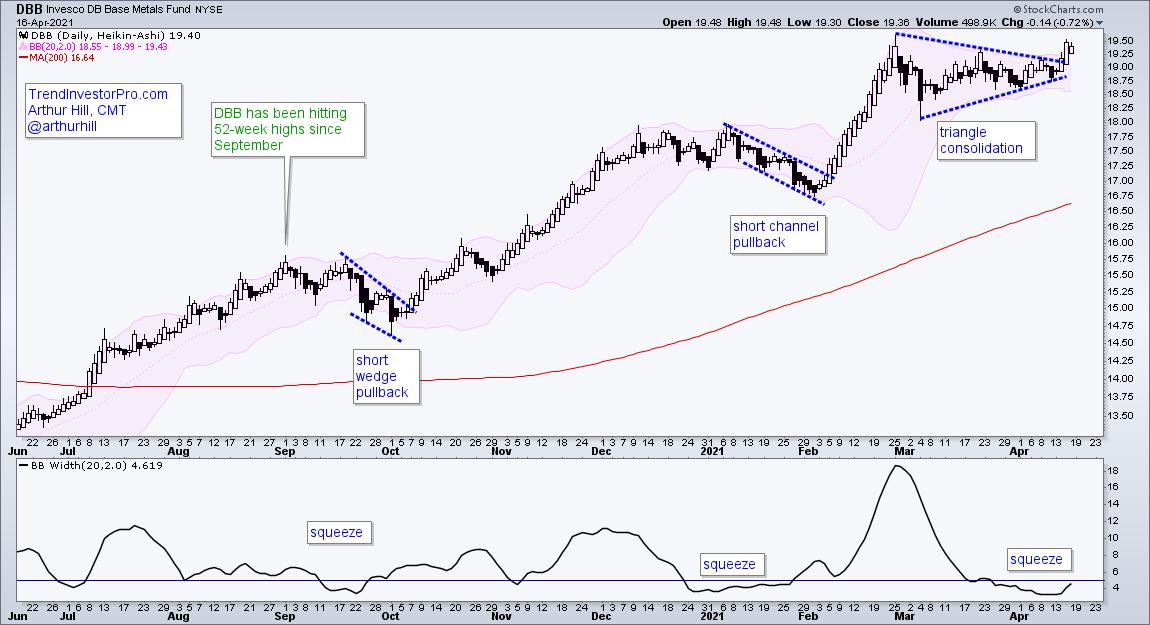
The indicator window shows BandWidth dipping below 5 to identify a Bollinger Band squeeze. This squeeze tells us that volatility is contracting and we should prepare for a volatility expansion (price move). This serves as an alert to monitor price action for a short-term bullish setup.
There are two completed bullish setups and one active bullish setup on the price chart. The blue dashed lines highlight the falling wedge and breakout, falling channel and breakout, and triangle (current pattern). A triangle within an uptrend is a bullish continuation pattern and this week's breakout signals a continuation of the bigger uptrend.
TrendInvestorPro specializes in capturing bullish setups and signals within bigger uptrends. Each week we monitor over 100 ETFs in our core list for trend signals, medium-term bullish setups and short-term triggers. Click here to cut through the noise and get immediate access.
---------------------------------------------------
Choose a Strategy, Develop a Plan and Follow a Process
Arthur Hill, CMT
Chief Technical Strategist, TrendInvestorPro.com
Author, Define the Trend and Trade the Trend
Want to stay up to date with Arthur's latest market insights?
– Follow @ArthurHill on Twitter


