I previously talked about Energy (XLE) being at a possible pivot point on Tuesday. It rallied strongly, leaving us with many potential choices for possible trades. Given the breakout in Crude Oil, one of the charts that I was drawn to on Wednesday was Natural Gas (UNG). Carl and I spotlight UNG often as we follow it closely. The chart has continued to shape up nicely -- since I spotlighted it on Wednesday, it has broken out.
However, I cannot forget that it looked very bullish earlier this year, with a cup and handle pattern as well as a reverse head-and-shoulders. Both patterns busted, which is why I have listed a stop level just below the double-bottom. At the same time, if it turns south and drops below the 20-EMA, I'll likely drop it (full disclosure: I own UNG) and wait for a new set-up.
We have a new short-term double-bottom on UNG, which has broken above the confirmation line of the pattern. The minimum upside target would be about $10.50. There is a new PMO crossover BUY signal and the RSI just hit positive territory. I also note a positive divergence between the OBV bottoms and the price lows of the double-bottom. There are risks, of course; I've already pointed out the busted patterns.
It is very positive to see this new breakout; we didn't have it when I presented this chart Wednesday. Now, instead of strong overhead resistance, we have a strong support level, as it has an overlap of the 50-EMA as well as the confirmation line. I've set a 9% stop that would indicate a breakdown from the double-bottom. As noted above, though, I don't think that I'll let it drop that low before selling it.

Free DecisionPoint Trading Room Mondays Noon ET

Click here to register in advance for the recurring free DecisionPoint Trading Room! Recordings are available!
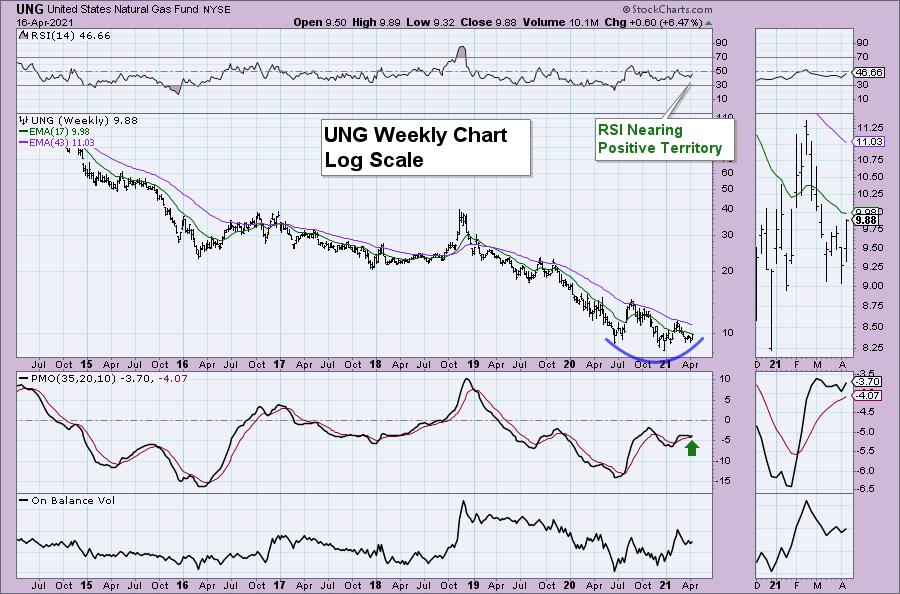
Let's take a quick peek at the Weekly Chart. It is in log scale so that we can see price movement better. We have a rounded bottom developing. The RSI is rising and should reach positive territory soon. The weekly PMO has just turned up above its signal line and is not overbought. I find that PMO bottoms above the signal line are especially bullish. The one issue I have with this chart is that price hasn't managed to cross above the 17-week EMA.
Conclusion: Overall I am very bullish on UNG. Consider a subscription to DP Diamonds or DP Alert. I presented this set-up on Wednesday to subscribers. Interested in 50% off your first month? Use coupon code: SAVE50 and your first month will be at half price so come check us out here!
Happy Charting! - Erin Swenlin
Technical Analysis is a windsock, not a crystal ball.

Helpful DecisionPoint Links:
DecisionPoint Alert Chart List
DecisionPoint Golden Cross/Silver Cross Index Chart List
DecisionPoint Sector Chart List
Price Momentum Oscillator (PMO)
Swenlin Trading Oscillators (STO-B and STO-V)
DecisionPoint is not a registered investment advisor. Investment and trading decisions are solely your responsibility. DecisionPoint newsletters, blogs or website materials should NOT be interpreted as a recommendation or solicitation to buy or sell any security or to take any specific action.


