Another wild ride in crypto space this week. Bitcoin dropped almost 10% in value against the US Dollar in the past five days, while market darling DOGE lost a whopping 27%, as did TRON, Bitcoin SV, EOS and a few other major coins.
If you are ever looking for action, check out the crypto market, but be warned - it is not for the faint of heart!
With regard to the title of this article, I have to admit it was a bit of clickbait... I'm sorry. Bitcoin was and still is the benchmark for digital currencies and IMHO it will remain so for the foreseeable future. However, Bitcoin's price chart did get damaged last week.
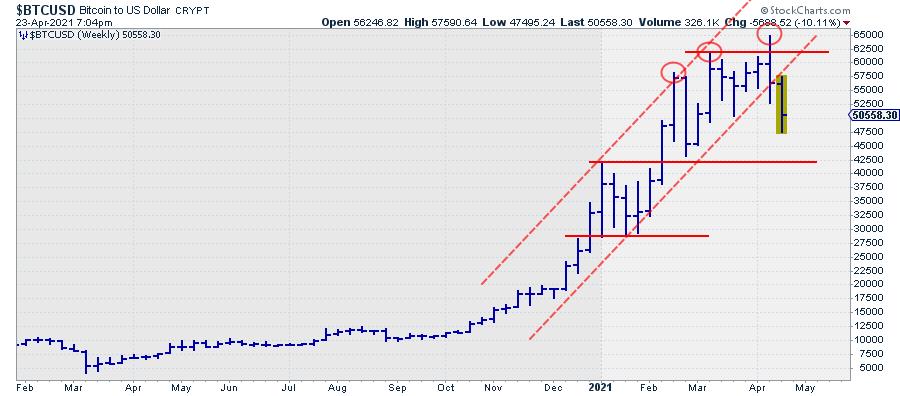
Until last week, the rhythm of higher highs and higher lows was still intact, but the last two highs were only marginally higher compared to the $58k peak in February. The push to a new high in the week of 12 April and the subsequent sharp decline marks the reversal from buyers pushing the market higher to sellers pushing the market lower.
With the setback continuing this week and a clear break of the rising support line that was in play since late last year, the path of least resistance is now to the downside, while the upside is sprinkled with resistance, most notably around $62.5k.
But Bitcoin is not the only cryptocurrency in town or in the StockCharts.com database. Very recently, the coverage of cryptocurrencies has broadened considerably. Take a look at www.stockcharts.com/crypto to find the complete list of digital currencies that are currently in the database. In total, it is around 150 coins, with a market capitalization above 1 billion USD. (At least at the time of inclusion, as I wouldn't be surprised to find out that a bunch has dropped back below 1BN after last week...)
I have been keeping an eye on the crypto market for a while now, as I am intrigued by how well these markets reflect fear and greed and are almost perfect for technical analysis. It's all about supply and demand. When I was working on the trading floors, people used to say "that's where you can learn it" on currency markets (fiat currencies that is, we're talking the 90's here). I think we can now safely change that to the digital currency market; it's pretty ruthless out there.
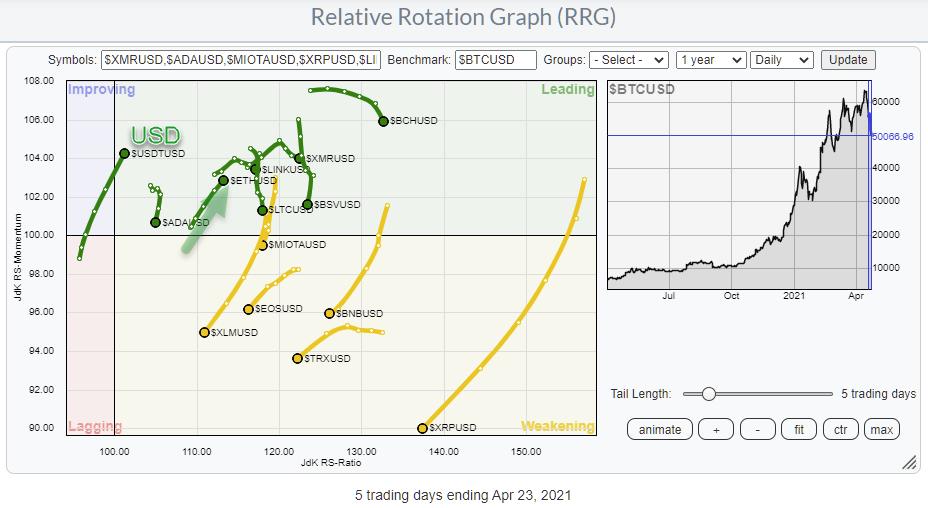
The RRG at the top of this article shows the rotations for the 15 biggest crypto names vs. Bitcoin as the benchmark. I have copied it again here for easier reference.
 What we see is that all tails are on the right side of the RRG, which means that all these cryptos are in an uptrend vs. BTC. In Crypto-Lingo, it is (or maybe it was) ALT-season...
What is also visible is that almost all of the tails are rolling over or have already done so and are now at a negative RRG-Heading. That means Bitcoin is regaining some relative strength in this universe. But with Bitcoin dropping sharply, that only means that the others are dropping even faster.
Two tails on the RRG above stand out, as they have a tail traveling at a positive RRG-Heading. These are $USDTUSD and $ETHUSD. $USDTUSD is pegged to the USD and can be seen as the USD in crypto-space. The fact that the tail is heading into the leading quadrant shows the weakness of BTC against USD at the moment. Another way to visualize the rotations of cryptocurrencies against the USD is to load the predefined universe for crypto against USD.
More interesting, however, is the rotation of the tail on Ethereum ($ETHUSD). It is inside the leading quadrant and pushing further into it while gaining on both axes.
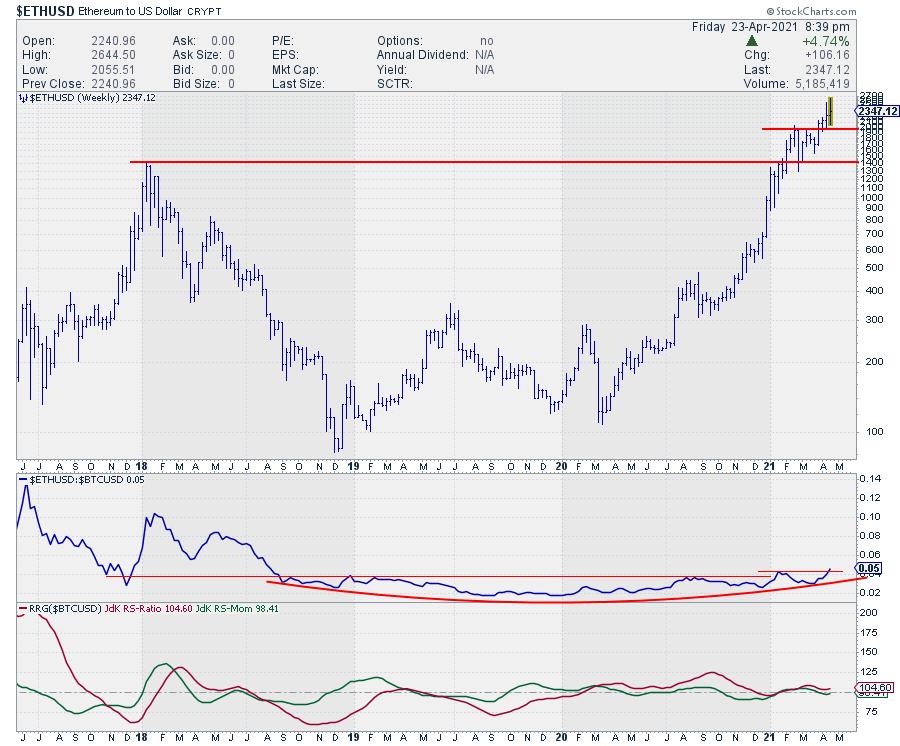
The chart of ETH is a bit longer-term and on a log scale, so we can better see the magnitude of the moves. It does limit the possibility of drawing angled trend lines, but it does give a good insight into how ETH is now managing to hold up above its Feb highs. Where BTC did not manage to hold above its previous highs, especially the FEB high, ETH remains comfortable above that breakout level, which shows that buyers are happy to pick up Ethereum above that $2k area. That possibly makes it THE strongest cryptocurrency at the moment.
Another benefit of this longer-term chart for ETH is that we can see the development against BTC over a longer period. After a decline in relative strength in 2017-2018, the negative momentum for ETH/BTC started to fade and, from late 2018 until now, ETH's relative strength vs. BTC slowly started to turn around. And, at the moment, ETH is breaking above that long-term overhead barrier, possibly igniting an acceleration of this strength.
For the time being, ETH is the new favorite kid on the block(chain).
#StaySafe, --Julius
My regular blog is the RRG Charts blog. If you would like to receive a notification when a new article is published there, simply "Subscribe" with your email address.
Julius de Kempenaer
Senior Technical Analyst, StockCharts.com
Creator, Relative Rotation Graphs
Founder, RRG Research
Host of: Sector Spotlight
Please find my handles for social media channels under the Bio below.
Feedback, comments or questions are welcome at Juliusdk@stockcharts.com. I cannot promise to respond to each and every message, but I will certainly read them and, where reasonably possible, use the feedback and comments or answer questions.
To discuss RRG with me on S.C.A.N., tag me using the handle Julius_RRG.
RRG, Relative Rotation Graphs, JdK RS-Ratio, and JdK RS-Momentum are registered trademarks of RRG Research.


