It's been a heavy earnings week, with many stocks gapping higher or lower based on investors' reactions to their quarterly results. With two particular stocks, AT&T (T) and Netflix (NFLX), this week was less about their ability to grow earnings and more about their potential to grow subscriber numbers in the coming months and years.
In this piece, we'll look at both stocks from a technical perspective, focus on their trends leading into and out of their earnings reports and reflect on the differences between these two key charts.
Join us Tuesday, May 4th at 1:00pm ET for a FREE webinar: "Sell in May: Five Charts You Need to Review". We'll discuss what five key charts are showing as we approach the seasonally weakest part of the calendar. Sign up here!
First, let's review the chart of Netflix.
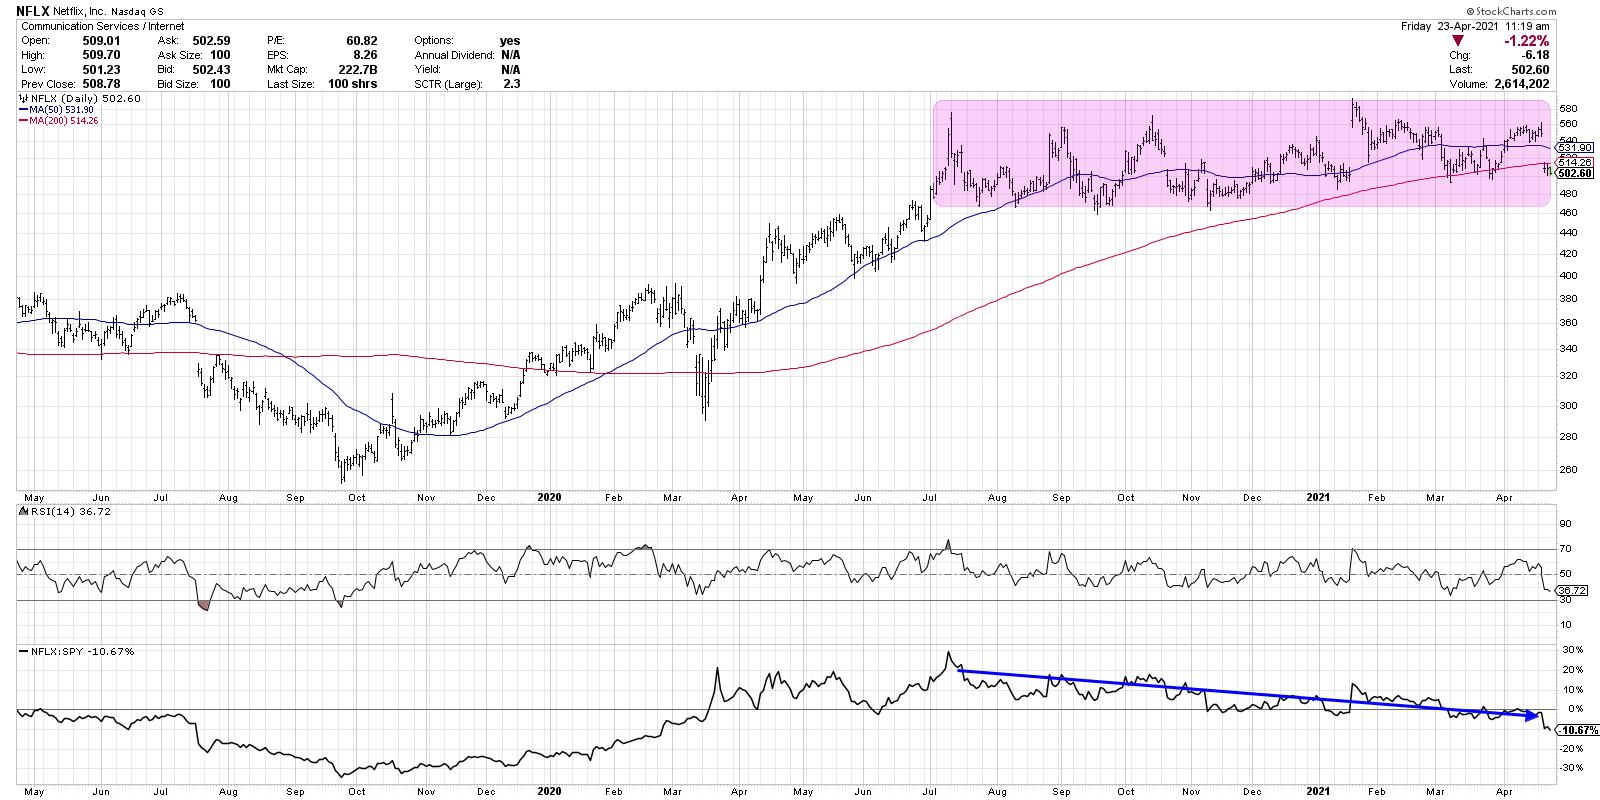
Netflix has essentially been "dead money" for the last eight months. Following a solid run to new all-time highs in July 2020, the stock has essentially been rangebound since then.
When we talk about the leadership and then laggardship of the FAANG trade, this chart of NFLX (in particular the relative strength line at the bottom) really tells the story of that leadership rotation. Following its earnings call on Tuesday, Netflix gapped down just below its 200-day moving average. NFLX has done this two times in the last two months, with two breaks below the 200-day in March being fairly short-lived.
Moving below this long-term smoothing mechanism was the first warning sign. If the stock breaks below the March lows around 500, that would indicate further price weakness. The most important "line in the sand" would be the bottom end of the eight-month price range around 460.
Now, let's look at the chart of AT&T, which owns the HBO Max service.
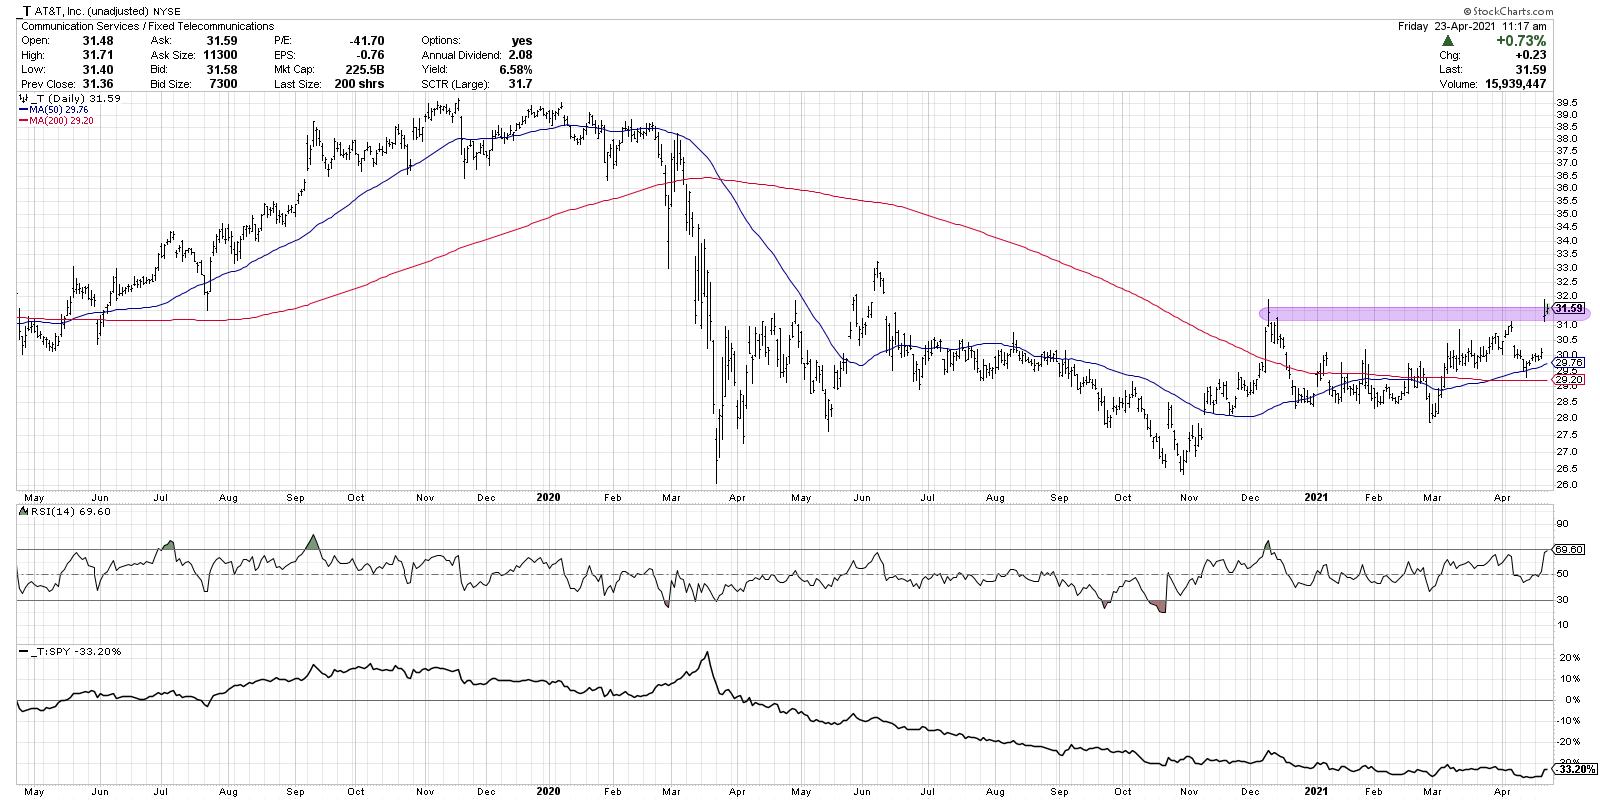
When you take the unadjusted price chart of AT&T, which removes the impact of a fairly large regular cash dividend, you can see that T has gapped up right to its Dec 2020 highs around 31.50. Given the strength this week, I would consider the path of least resistance to be higher, assuming the stock is able to make a new six-month price high. It's also worth noting that this is one of the highest dividend payers around, with a yield of around 6.6% given current price levels.
In recent weeks, AT&T had pulled back beautifully to an ascending 50-day moving average, which often serves as support during long-term uptrends. If the stock pulls back in the coming weeks, that moving average could serve as actionable support.
Overall, these two stocks have been all about the subscription trends for Netflix and for AT&T's HBO Max. While the earnings results this week provided a catalyst for price gaps on both charts, I would argue that signs of strength and weakness have been evident before this week.
Want to see this article in video format? Just check out my YouTube channel:
RR#6,
Dave
PS- Ready to upgrade your investment process? Check out my free course on behavioral investing!
David Keller, CMT
Chief Market Strategist
StockCharts.com
Disclaimer: This blog is for educational purposes only and should not be construed as financial advice. The ideas and strategies should never be used without first assessing your own personal and financial situation, or without consulting a financial professional.
The author does not have a position in mentioned securities at the time of publication. Any opinions expressed herein are solely those of the author, and do not in any way represent the views or opinions of any other person or entity.


