I love earnings season. Perhaps it's the CPA inside of me, having practiced in public accounting for a couple decades. Maybe it's the excitement of new fundamental information being released that alters the valuation of companies. But mostly, I think, it's the short-term inefficiency of our market-making system, which creates tremendous profit opportunities -- if you know how to recognize them and then have the patience to allow them to set up.
Stocks trade a number of different ways heading into earnings season and just after their quarterly numbers are released. You have to have an open mind and see the big picture. Sometimes I view one MAJOR support level as THE entry point. Other times, I consider support ZONES where a stock could be accumulated.
Trade Setup #1 - The Pre-Earnings Hype
Many times, it's absolutely unmistakable; you can see a stock go through a significant buying period just before its earnings are released. As an example, let's study MKS Instruments, Inc. (MKSI), currently a $10.8 billion semiconductor company. On January 27th, here were the numbers released on MKSI:
- Revenues: $660.2 million (actual) vs. $605.2 million (estimate)
- EPS: $2.34 (actual) vs. 2.03 (estimate)
Those are blowout-type numbers. But during the three months leading up to earnings, MKSI's stock price ran from a low of $105.71 on October 28th to a high of $192.06 on January 20th. That's an 82% advance in 3 months. You have to at least be thinking, "there's a lot of good news built into the MKSI stock price." Sometimes, management teams aren't always 100% truthful when they meet with Wall Street analysts. If results disappoint after that kind of advance, the downside can be devastating. HOWEVER, I would be expecting extremely strong numbers after I see an advance like that. The second problem to be aware of, though, is that old Wall Street adage, "buy on rumor, sell on news." It happens ALL THE TIME.
When MKSI reported excellent results, beating both revenue and EPS estimates, I immediately added the stock to our Strong Earnings ChartList, an organized ChartList that our EarningsBeats.com members can view (or preferably download into their StockCharts.com Extra or Pro account). I also annotate what I view as solid support levels. Take a look at the MKSI chart a few days after earnings:
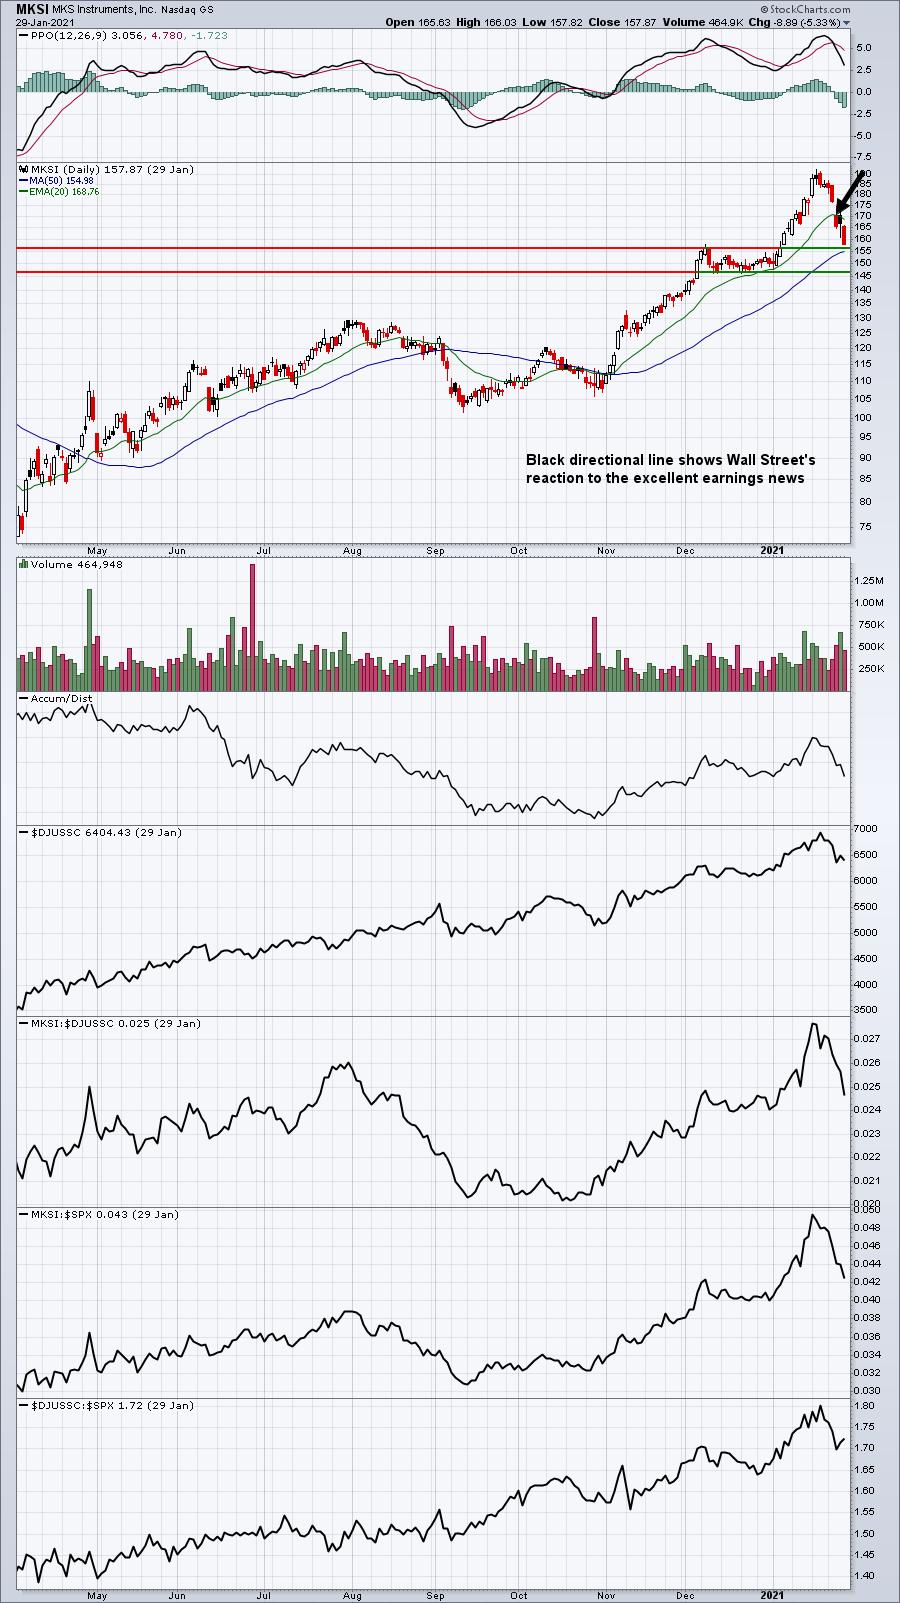
So MKSI announces blowout earnings and the stock tanks roughly 11% over the next three days, now down nearly 35 bucks since that pre-earnings high of $192. If you're like the rest of us, you know how it feels to buy a stock at its high, only to watch your investment sink almost 20% in just 7 trading days. At that point, you don't want to hear what a GREAT quarter it had! Instead, you're probably thinking, "how do I get out of this dog before I go broke?" That's where our research at EarningsBeats.com hopefully helps.
First, I always say to avoid holding stocks into earnings reports, especially stocks that have run like MKSI ran. I would fully expect a blowout report, but that does not always translate into higher prices after earnings. MKSI is a perfect example. Second, it's important to realize that there are a lot of other stocks with tremendous growth and potential within the semiconductor space. You don't need to look at just one. So, after I review earnings reports, I annotate these "Strong Earnings ChartList" stocks for our members by adding a couple support lines for our members to consider if a stock subsequently sells off after earnings. This is how MKSI now looks (check out where the subsequent bottoms occurred):
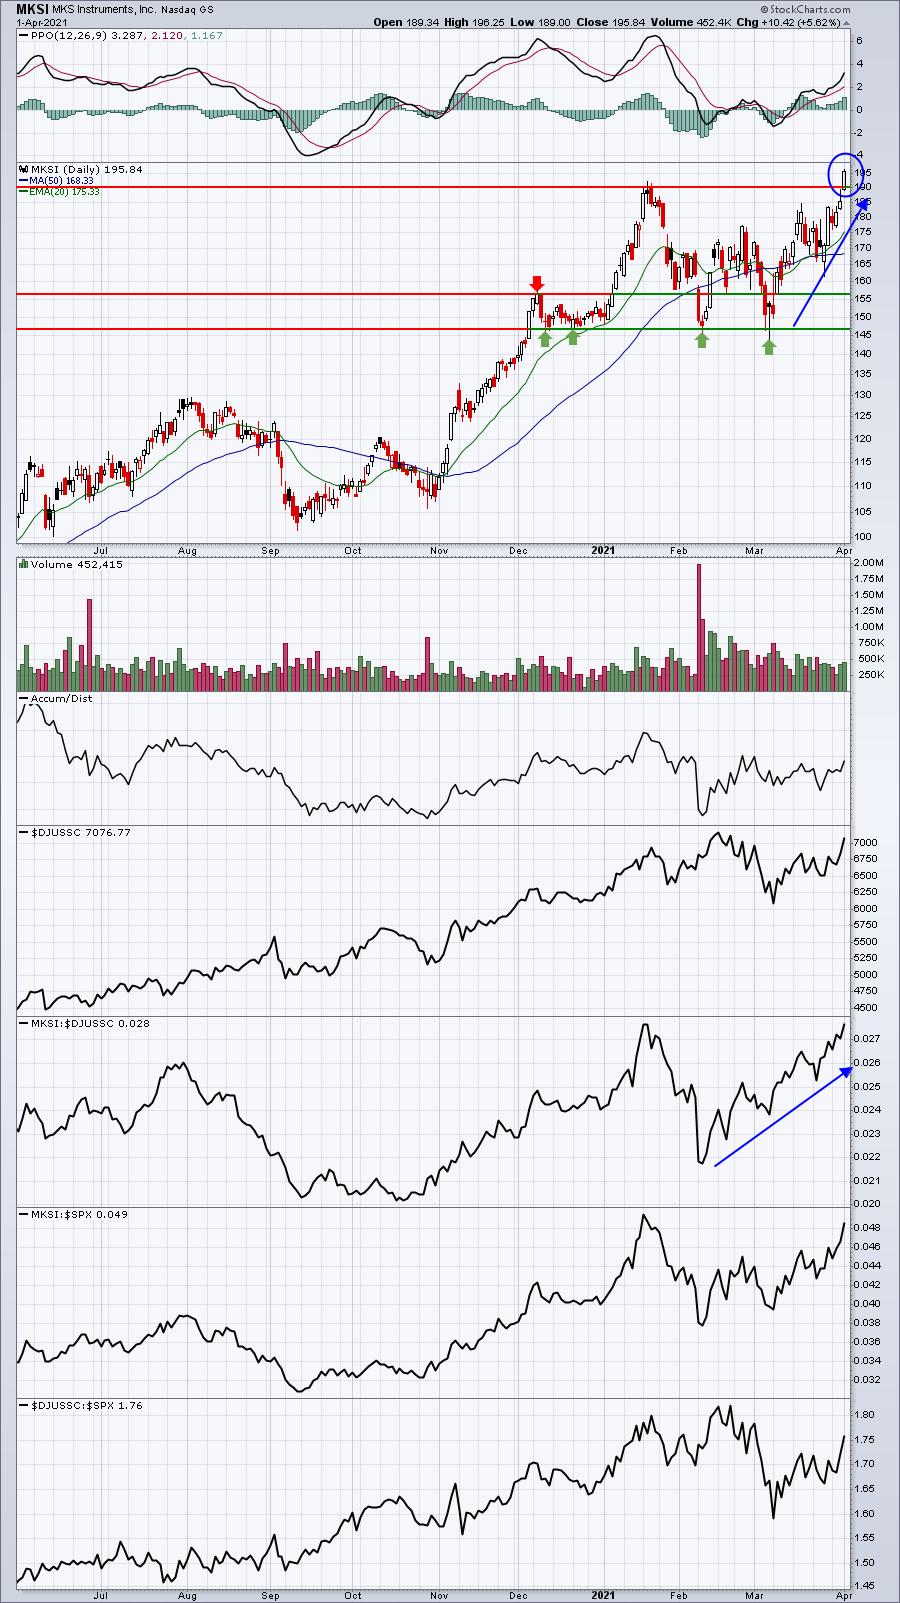
The two support levels are simply "best guesses" as to where a stock may turn back higher. They're educated guesses, but guesses nonetheless. That means keep closing stops in place in the event these support levels do not hold on the close. The first support line that I drew was at roughly 157. That was the previous high in early December. Broken resistance becomes price support - that's Technical Analysis 101. Key support levels also are established at prior price lows. There were multiple lows back in December near 147, so that was the second support level that I annotated. When MKSI pulled back hard in both early February and early March, that second support level held and was an EXCELLENT entry point. Now we see MKSI breaking out again with its next earnings report expected out on April 27th.
Rinse and repeat.
Trade Setup #2 - Massive Gap Support
Here's my favorite setup and the one that I am generally most confident about. A stock consolidates for a period of weeks or months and gaps higher on MASSIVE volume when its better-than-expected quarterly earnings report is released. But that's not all. Not only does it gap up above prior resistance, but it continues moving higher throughout the day, printing a huge hollow candlestick (closing price is well above the opening price).
Why does this matter? Well, our market-maker system is designed for market makers to make money. Otherwise, they would never want to commit their capital. When a stock has great news and gaps higher, there's a ton of excitement and buyers are EVERYWHERE. Market makers see the orders lining up to buy and they use that demand-supply imbalance to their advantage by determining an opening price that's much, much higher than the prior day's closing price. At the opening bell, when buyers are trampling each other to get into a stock, market makers are happily shorting the stock. They frustrate the buyers, the demand dries up, and market makers continue shorting to drive prices lower short-term. Many times, it results in a "gap fill," where a stock price gaps at the opening bell but then returns to the prior closing price. Those who bought at the opening bell then panic as prices retreat and they sell, allowing market makers to then cover their short position. It happens over and over again, which is why our market maker system works. It's a profit machine for the Goldman Sachs of the world.
Astute technical traders understand the system and use it to their advantage.
Occasionally, we see a stock gap higher, but the demand is SO great that even the market makers cannot slow the tide of buying. That results in a huge hollow candle on VERY HEAVY VOLUME. The volume and the hollow candle are both equally important. Without the heavy volume, it's difficult to make the argument that the demand was off-the-charts and forced market makers to cover the shorts initiated early in the trading session. Market makers do not make money on every trade; they're traders like us and have bad trades and bad days. Seeing the order flow gives them a huge advantage, but it doesn't insulate them from losses.
Enter Zscaler, Inc. (ZS), a $23.9 billion software company. I love a stock that gaps higher with a previous earnings report, continues running to the upside, then later returns back to the top of gap support. That last part is key. When a company reports strong numbers and the demand is so great that market makers cannot create a "gap fill," I look to the TOP of gap support as the key entry point. I don't look for a move down to the bottom of gap support to complete that gap fill.
On December 2nd, ZS reported the following quarterly numbers:
- Revenues: $142.6 million (actual) vs. $132.3 million (estimate)
- EPS: $0.14 (actual) vs. $0.06 (estimate)
In addition to blowout revenue and EPS, ZS also raised its guidance for the next quarter and the next year. Unlike MKSI, ZS had been consolidating sideways prior to its quarterly earnings release. Take a look at what the ZS chart looked like the next day as Wall Street reacted:
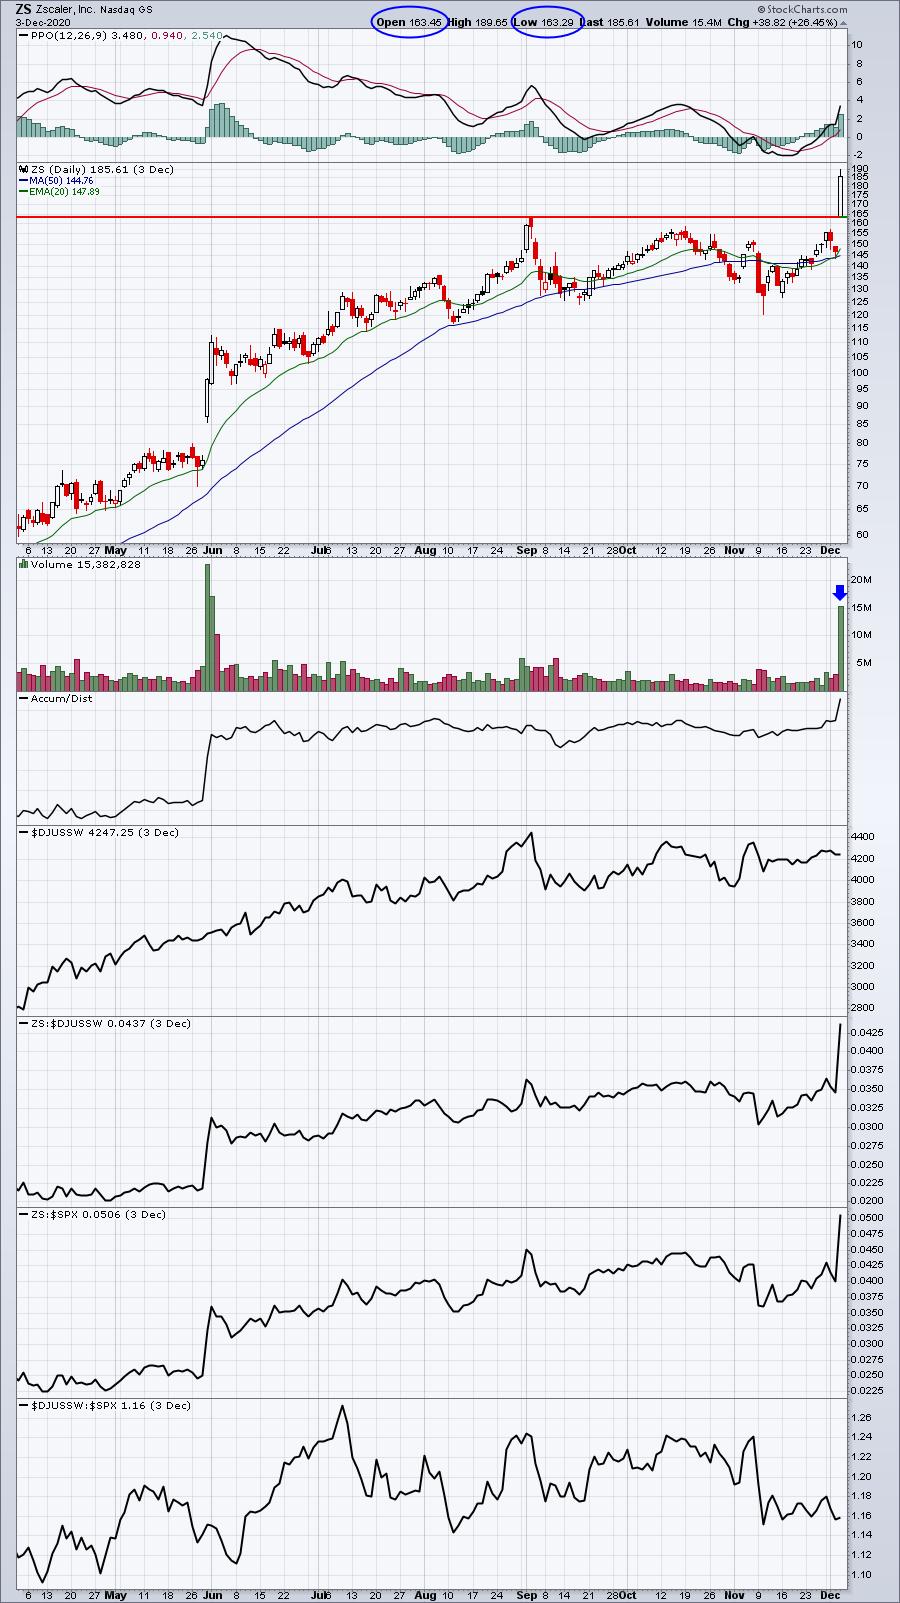
I want to point out two things on this chart. First, note that the opening price and the low for the day were almost identical. There was clearly an imbalance between buyers and sellers at the opening bell, which caused the huge gap up. But market makers, which would have been initially shorting ZS at the opening bell, never were able to gain control of the stock and most definitely had to cover their short positions at higher prices, resulting in loss. This is a picture of inordinate demand. That's my second point -- the volume. Do you see how the volume swamps normal daily volume? I LOVE this, because now that opening price of 163.45 is on my radar. ZS may trade at this level again in a week, a month, or maybe longer. But when it gets there, I'm going to expect buyers once again -- this time the market makers will be buyers at support, not sellers.
Let's fast-forward to Tuesday this past week. In my Daily Market Report (DMR) to EarningsBeats.com members, I featured BL, CRWD, SKLZ and ZS as potential trade candidates based on reversing candles that were printing off downtrends. All four rebounded nicely the past two days (roughly 10% or more). ZS, in addition to printing a reversing hammer candlestick, had also finally returned to the "scene of the crime" and tested that 163.45 opening gap support. In this case, it took nearly 4 months to work its way back to that level, but it finally happened, triggering an excellent entry opportunity:
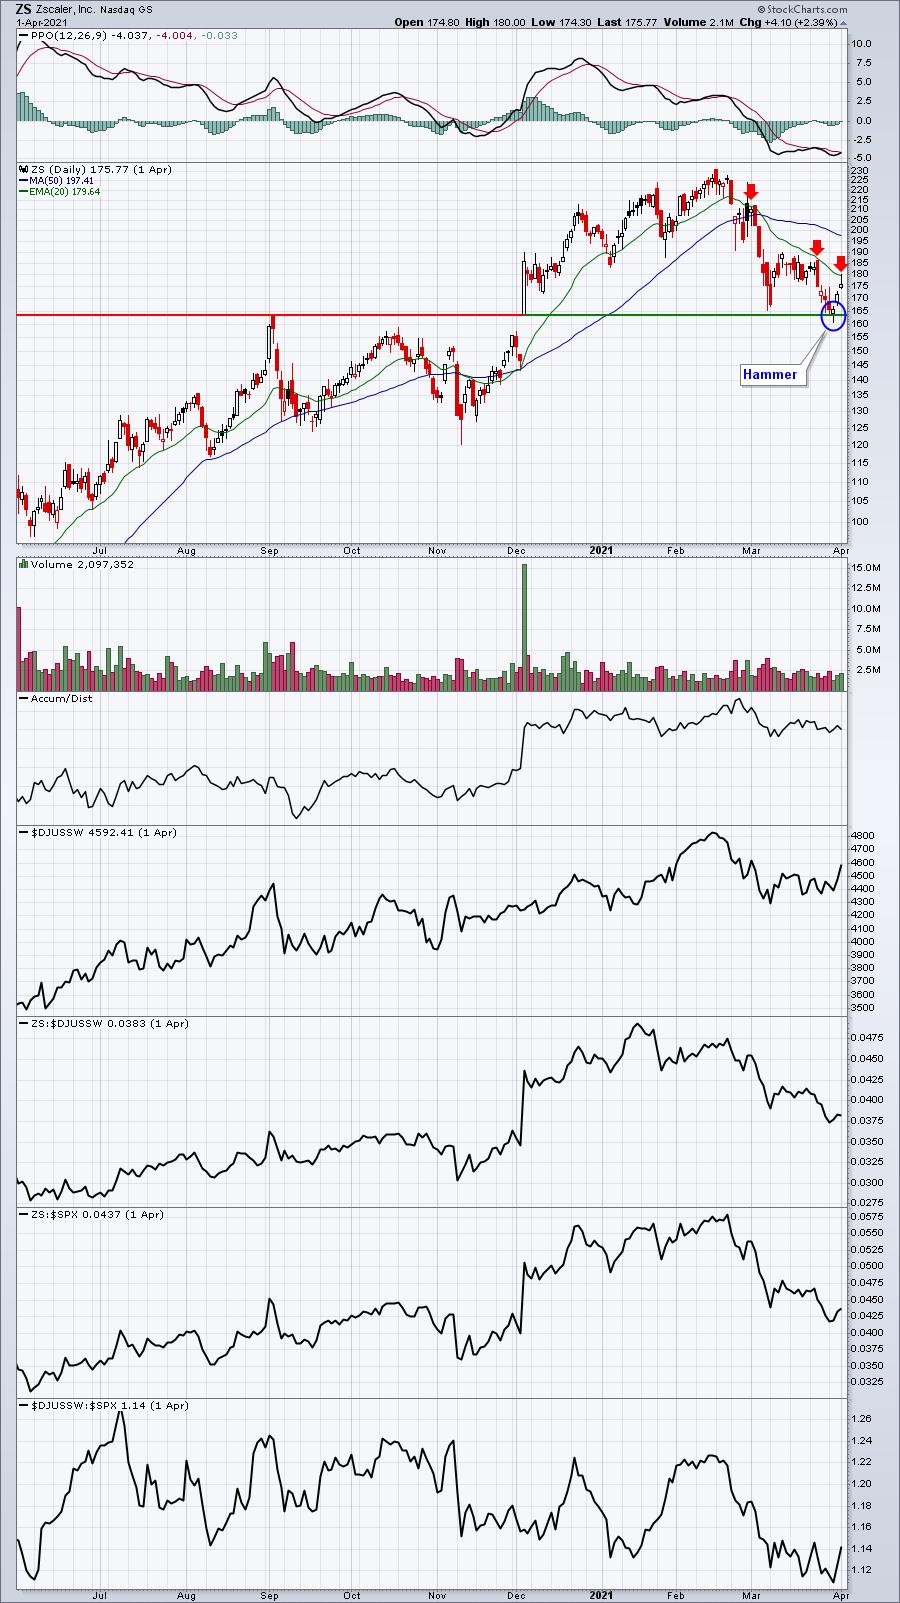
Personally, I wait until just before the close to see if that gap support will hold, then I pull the trigger on a trade. As an alternative, a stock like ZS could have been bought at 163.45 in anticipation of gap support holding. That simply depends on what type of risk you're willing to take. The next day, ZS moved back above 170 and I sold 50% of my position. On Thursday, as it approached the declining 20-day EMA, I sold the rest. I made a little more than 6% on this trade in two days. If I had bought at the 163.45 level and simply waited to sell at the 20-day EMA, I would have made approximately 10%. I try not to get greedy.
These were both great opportunities. It's also why I LOVE earnings season, because short-term market inefficiencies can be used to our advantage. Earnings season is once again right around the corner with big financials like JPM, WFC and GS set to report their quarterly results the morning of Wednesday, April 14th. We'll do the research for you if you're interested in taking advantage of earnings-related trading opportunities. You can join us with a no-cost 30-day trial HERE.
If you haven't already joined our EarningsBeats.com community, please consider subscribing to our FREE EB Digest newsletter, published 3x per week. There is no credit card required and you may unsubscribe at any time without hassle. As a bonus, I'll be detailing another earnings-related trade opportunity in our Monday morning edition of EB Digest. CLICK HERE to start your free subscription TODAY and receive Monday's trade setup!
Happy trading!
Tom


