In today's "Diamond Mine" Trading Room (DP Diamonds subscribers only), I was asked if it was time to go long on Gold given its rally this week. Well, if we are talking about "longs," we should start at the monthly chart and work down to the daily chart.
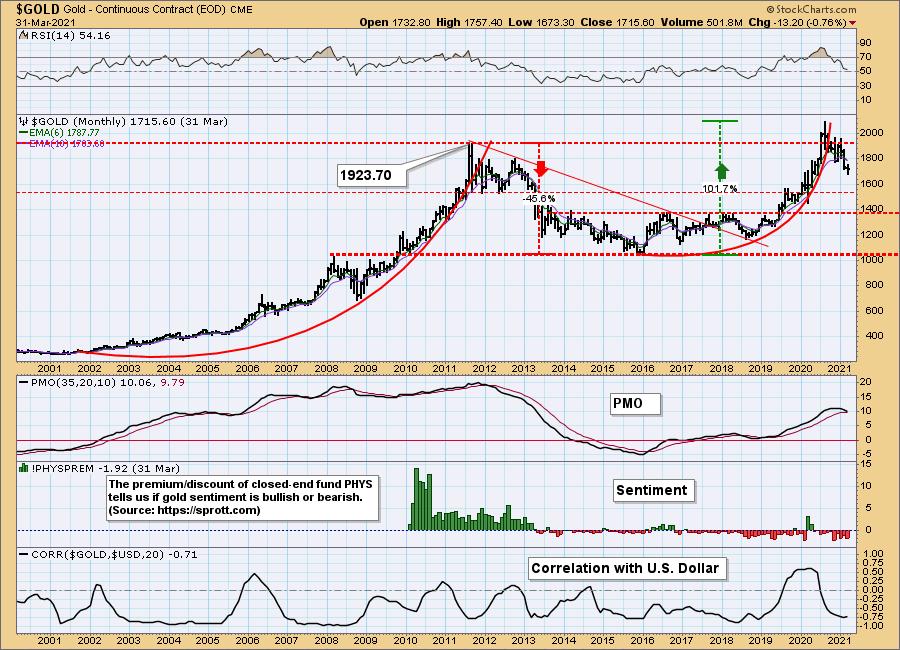
Gold's monthly chart as of March 31st is below. The monthly PMO is just about ready to give us a crossover SELL signal. We do have a cup and handle look, but I wouldn't call it a cup and handle given the left side of the cup is lower than the right. This is a bottoming formation and that isn't what we have here. Notice the reverse correlation with the Dollar is strong, meaning a rising Dollar is going to put pressure on Gold prices.
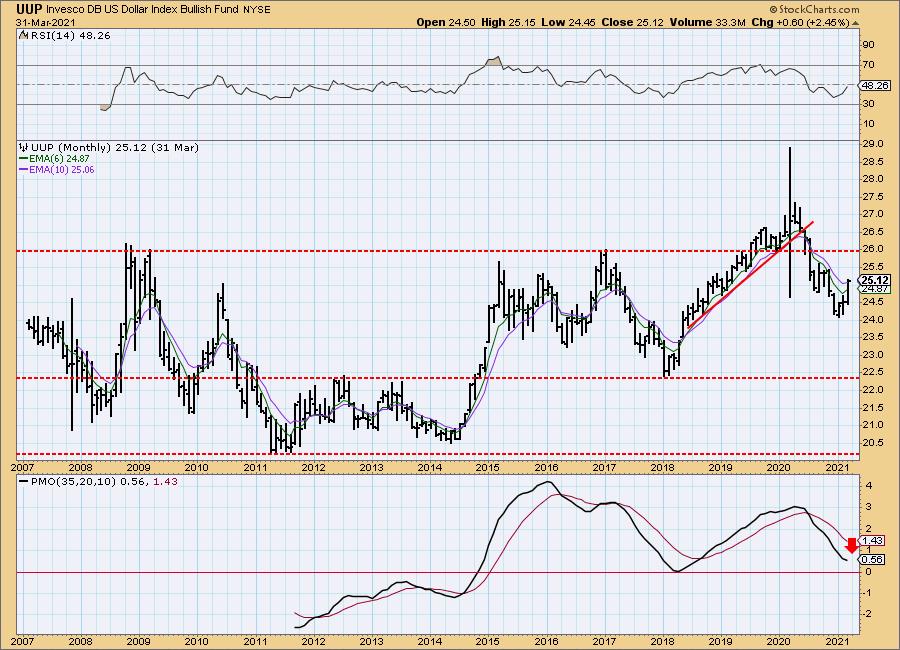
For a little bit more perspective, here is the Dollar's monthly chart from March 31st. Notice this chart is beginning to look more bullish. This will be a problem for Gold in the long term if this new rally in the Dollar is going to continue.
DPA: Clear and Concise Daily Market Commentary

DP Diamonds: Easy-to-Understand Stock Analysis
Try us out for a week! Subscribe to the Bundle and use coupon code: DPTRIAL. You'll find all of our reports going back to October 2019. Review our commentary and "diamond in the rough" picks that go back to before the 2020 bear market and enjoy the quality commentary from Carl and Erin Swenlin.
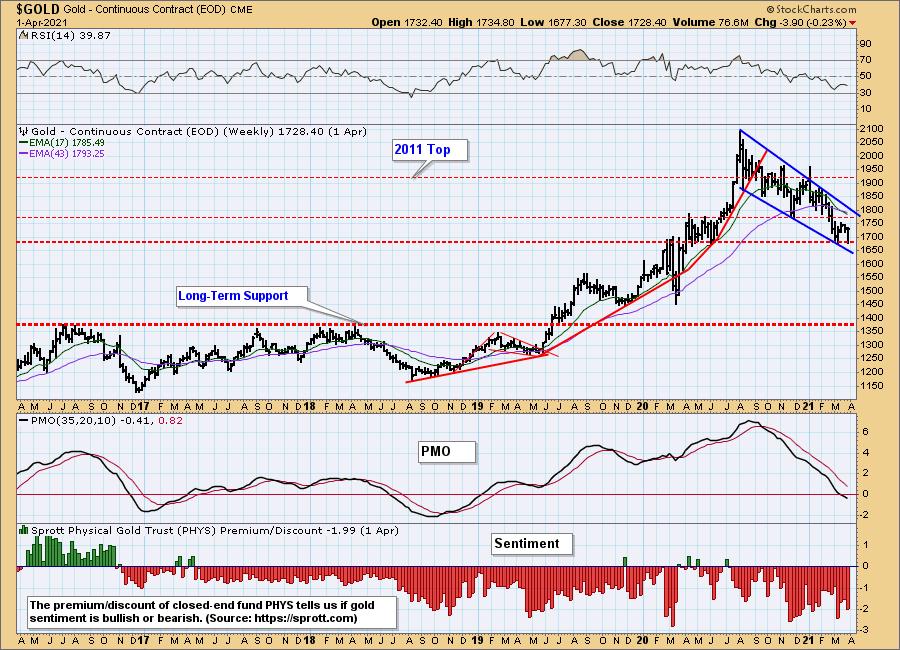
The weekly Gold chart has bearish characteristics, but also some bullish ones. The bearish ones are most obvious: a negative and declining RSI and a now-negative PMO that is falling. There is also a negative crossover of the 17-/43-week EMAs. However, there are a few things that gold bugs can hang their hat on. The dominant patterns are a very large bull flag and a bullish falling wedge that makes up the flag. With Gold bouncing off support, price won't test the bottom of the wedge. If the rally continues and the bottom of the wedge is not tested, that implies we will see the breakout from the wedge on the next rally. Still, it seems too early, as we don't know if this week's bottom will hold.
Mary Ellen McGonagle Joins Erin This Monday, April 5th, in the DecisionPoint FREE Trading Room!

Click here to register in advance for the recurring free DecisionPoint Trading Room! Recordings are available!
It's finally time to review the daily one-year chart for Gold. This week's bounce off support has started to form a double-bottom pattern. The pattern won't be confirmed until we get a breakout above the March top. The PMO has formed a bottom above its signal line, which is especially bullish. The RSI isn't positive yet, but if the rally continues on Monday, it will be. We see that discounts are rising and nearing oversold territory, which bodes well for Gold prices. The problem is overhead resistance. This will be difficult for Gold to overcome, especially if the Dollar begins to rally again. Resistance near-term is at the 20-EMA, but the next level is sturdy as the 50-EMA is right on overhead resistance. That resistance line has many "touches" by price. The more touches, the stronger it is.
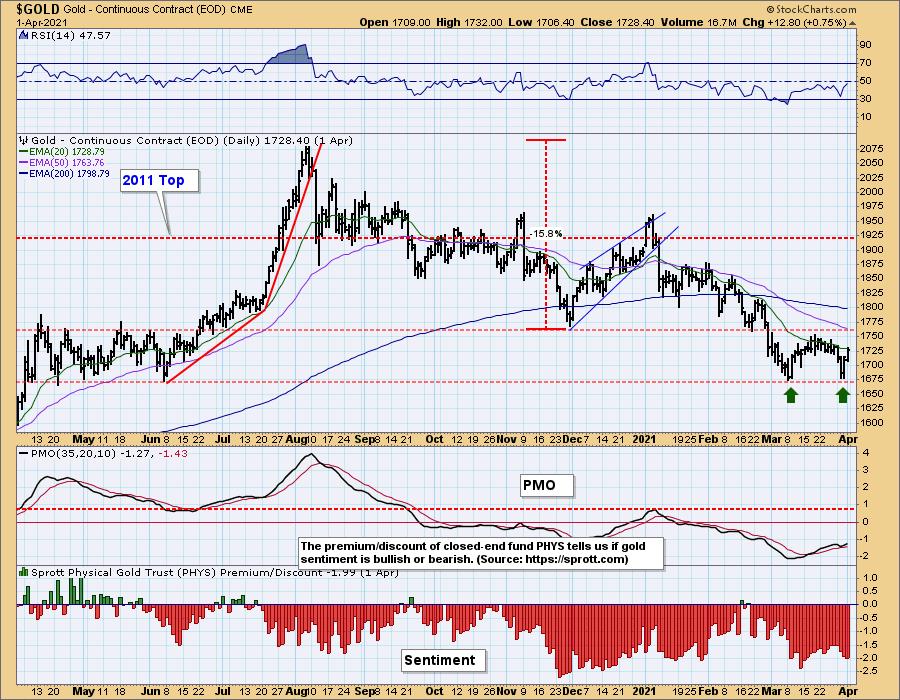
CONCLUSION: Where does that leave us as far as the question of going long on Gold right now? All timeframes have issues. This looks like a solid short-term bottom, but, with such strong overhead resistance, it seems more likely that we will see a trading range similar to last May-June trading range.
Happy Charting! - Erin Swenlin
Technical Analysis is a windsock, not a crystal ball.
Helpful DecisionPoint Links:
DecisionPoint Alert Chart List
DecisionPoint Golden Cross/Silver Cross Index Chart List
DecisionPoint Sector Chart List
Price Momentum Oscillator (PMO)
Swenlin Trading Oscillators (STO-B and STO-V)
DecisionPoint is not a registered investment advisor. Investment and trading decisions are solely your responsibility. DecisionPoint newsletters, blogs or website materials should NOT be interpreted as a recommendation or solicitation to buy or sell any security or to take any specific action.


