The S&P 500 reached a high on Friday of 4233.45, narrowly eclipsing the all-time high close of 4232.60 from May 7th. Unfortunately for the bulls, selling in the final few minutes ruined the breakout attempt. This false breakout, ever so slight, could be quite ominous for next week and there's one MAJOR reason why.
Inflation data.
That May 7th all-time high came just days before the shocking April CPI data was released on May 12th. Now here we are back at the high again. As the late Yogi Berra might say, "it's deja vu all over again!" I don't believe inflation to be a problem, but just the possibility of it could trigger scary headlines and encourage selling in the week ahead. First, let's look at the "almost" breakout on Friday and then how the past several weeks evolved in terms of S&P 500 performance and key rotation:
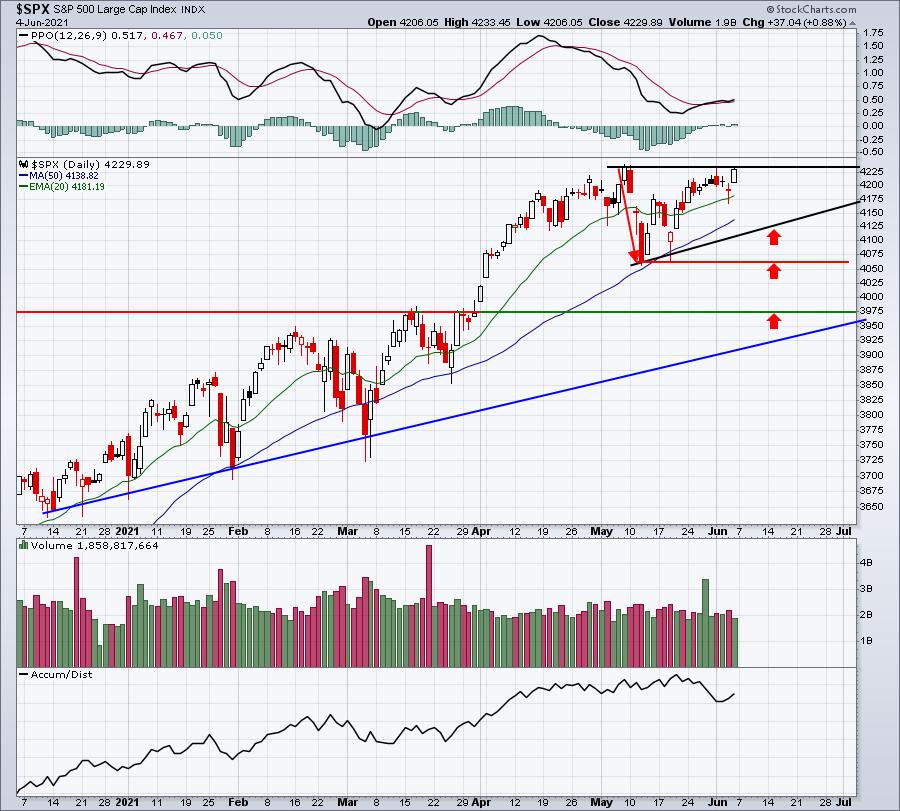
First, if we break out next week, that would be a bullish development that would trump everything else I'm discussing. I nearly always respect an all-time high. The only time I'd be leery would be if the strength that carried us to that all-time high came from defensive areas of the market.
On this next chart, look at how the market prepared before those last CPI/PPI reports were released:
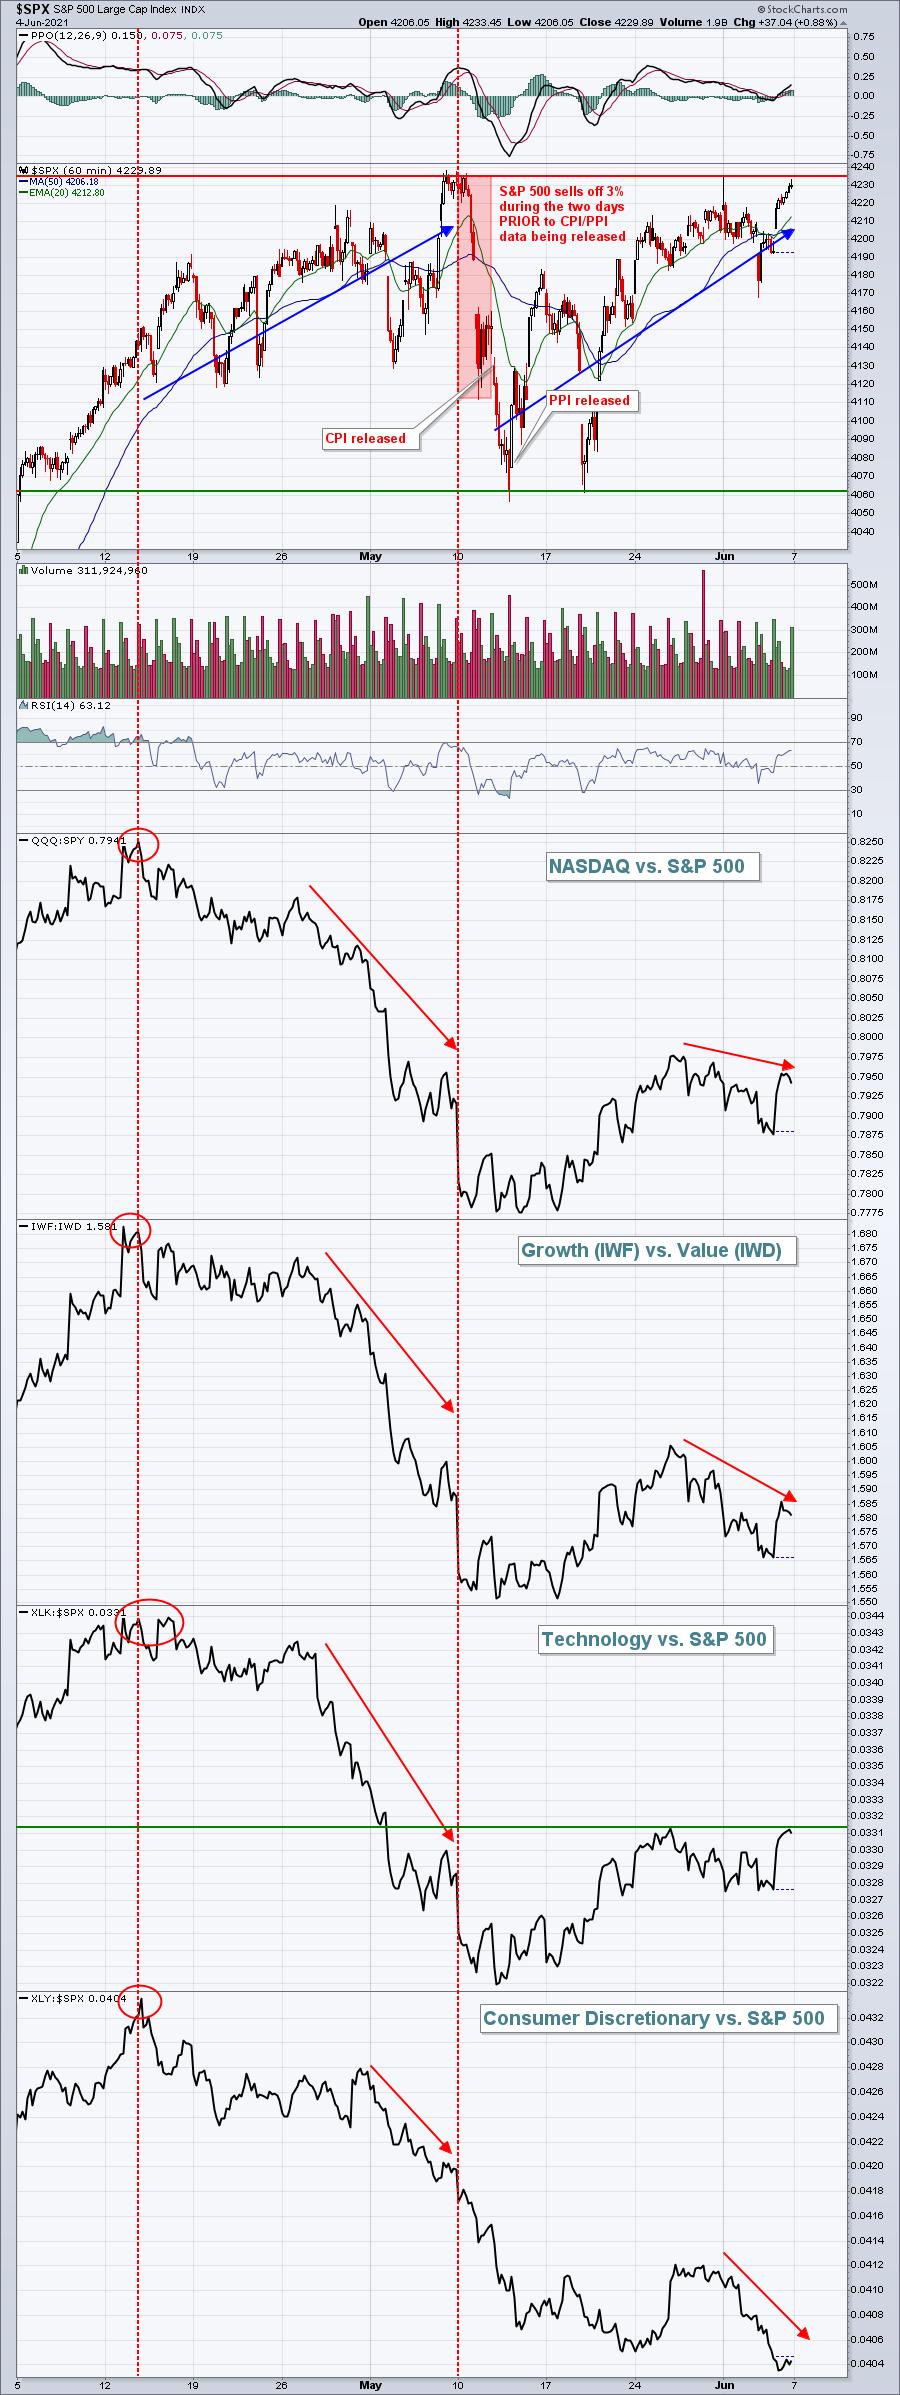
The market braced for bad news, as the S&P 500 lost 3% on the Monday and Tuesday prior to April CPI and PPI being released. Will we see that again this month? There's no way to know for sure, but I fully expect we'll get some shocking headline CPI numbers on Thursday morning. From the above chart, you can see the rotation that's been taking place. The S&P 500 has returned to its prior high, but note that none of these ratios are anywhere close to their recent highs. When these ratios all begin trending higher, we'll know that inflation news is in the rearview mirror. For now, we need to be cautious.
Let me be clear that I do NOT believe inflation will be a problem. The year-over-year numbers look bad for two reasons. First, we're replacing negative monthly numbers from March, April and May of 2020 with much higher numbers in March, April, and May (this Thursday) of 2021. That's sending the annual inflation rate soaring. Here's the Core CPI chart for a visual:
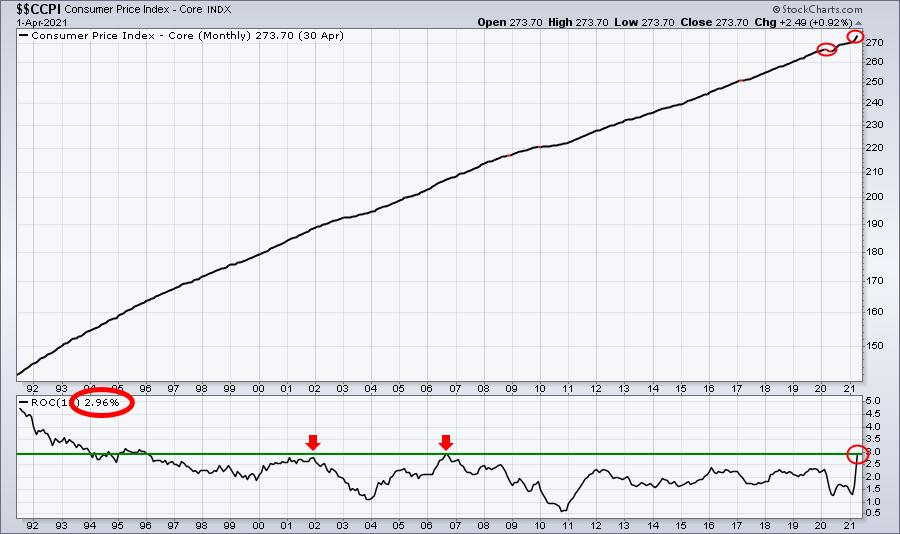
The red circles highlight the drop in Core CPI in the Spring of 2020, the soaring Core CPI the past few months and the 12-month rate of change (ROC). On Thursday, it's quite likely we'll see headlines that say inflation is at its highest level in 25 years. Get ready for it.
The second reason that the year-over-year number keeps rising is that we've had a major supply chain disruption. Demand has been accelerating as GDP has hit its highest level in decades at a time when we have supply shortages in so many areas. This temporary imbalance in demand vs. supply is overstating the true inflation picture. So while I don't believe inflation will be problematic AT ALL, scare tactics are often used in the financial media to allow professionals an opportunity to buy cheaper. We saw it last month and we may see it again this week.
To provide our EarningsBeats.com community with the best current information on inflation and its likely impact next week, I'll be hosting a special event, "Preparing For Shocking Inflationary Data", on Monday, June 7th at 4:30pm ET. It's open to everyone and completely free. I'll be discussing ways to protect your portfolio in the event that we do see that negative reaction throughout the week ahead (and possibly longer). We'll be providing a room link in our EB Digest newsletter on Monday morning so that you can join us. Our EB Digest is our FREE newsletter (no credit card required, so simply subscribe by providing your name and email address HERE -- scroll down on our home page) and we'll send you room instructions to attend Monday's event in the Monday morning newsletter.
Also, we've started our Spring Special, which is our best annual deal of the year. Pay for 12 months and you'll receive two additional months for free! It represents a 52% savings from our regular monthly rate. Lock in the savings now as our Spring Special will end on June 15th!
Happy trading!
Tom
