The improvement of commodities started already back in early 2020. Looking at long-term (monthly) charts, that rally seems like one straight move higher.
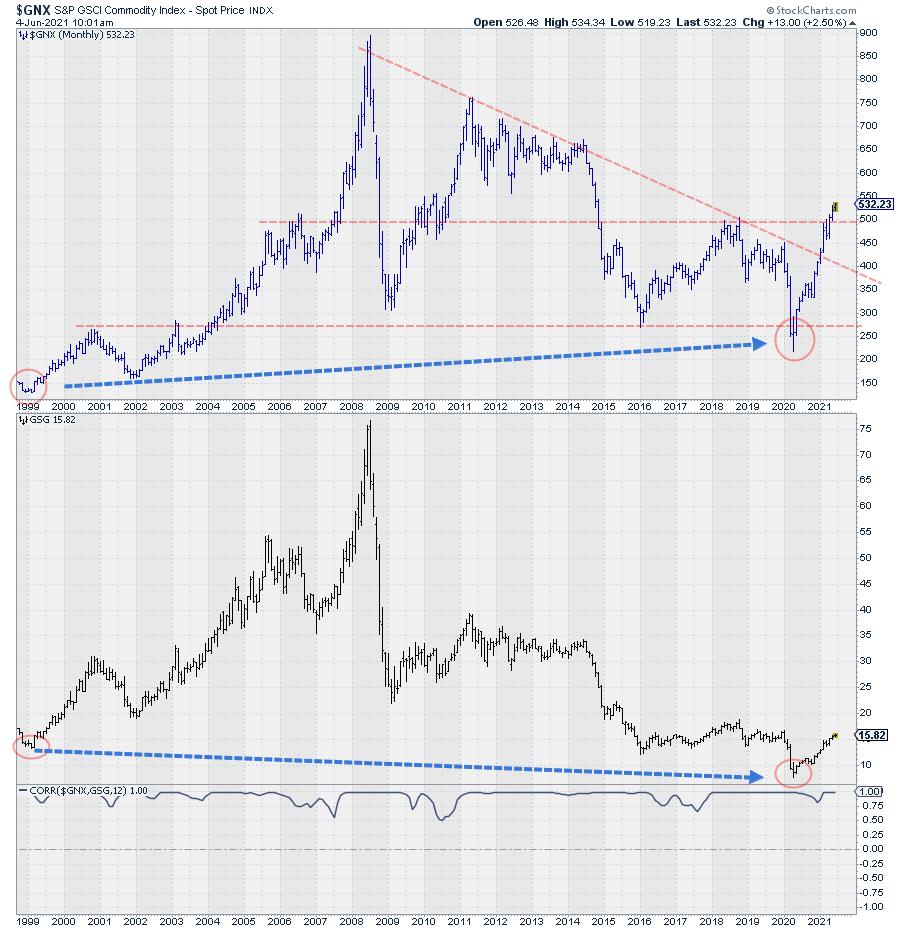
This chart shows $GNX and GSG stacked on top of each other. ($GNX is the S&P GSCI Commodity Index and GSG is the iShares S&P GSCI Commodity-Indexed Trust, the ETF that tracks $GNX.) Just by eyeballing the two charts, you can immediately see this, despite the fact that they should mimic each other.
I have added two big arrows comparing the position of the recent low with the 1999 low. As you can see, the last low in GSG is below the 1999 low, while the last low in $GNX is well above the 1999 low. Going over the chart, you will find a few more of these highs and lows being out of whack compared with the index.
Is that a problem? Not really as long as you are aware and understand what is going on.
This index is calculated using 24 exchange-traded futures contracts on physical commodities. However, commodity futures markets are a bit less straightforward than cash equities. The prices for futures contracts with different maturities are not always at the same level. These effects are called contango and backwardation, and they need to be taken into account for the pricing of an ETF like GSG, as it can cause significant differences, particularly when comparing over very long periods of history.
I have also plotted the 12-month correlation between $GNX and GSG and, as you can see, that is almost at or very close to 1, with the exception of two periods in 2007 and 2010. What this means is that GSG moves very much in line with $GNX and, therefore, GSG can very well be used as the instrument to create exposure to the commodities market.
With the long-term turnaround now well underway and the recent confirmation of the underlying strength after breaking the falling resistance line, as well as the 2018 high, it makes sense to have a look inside the broad GSCI commodity index and see if any sectors are to be preferred.
The breakdown of $GNX
The S&P GSCI Commodity index, based on 24 futures contracts, is broken down into five sectors:
- Energy - $GJX
- Industrial Metals - $GYX
- Precious Metals - $GPX
- Agricultural - $GKX
- Livestock - $GVX
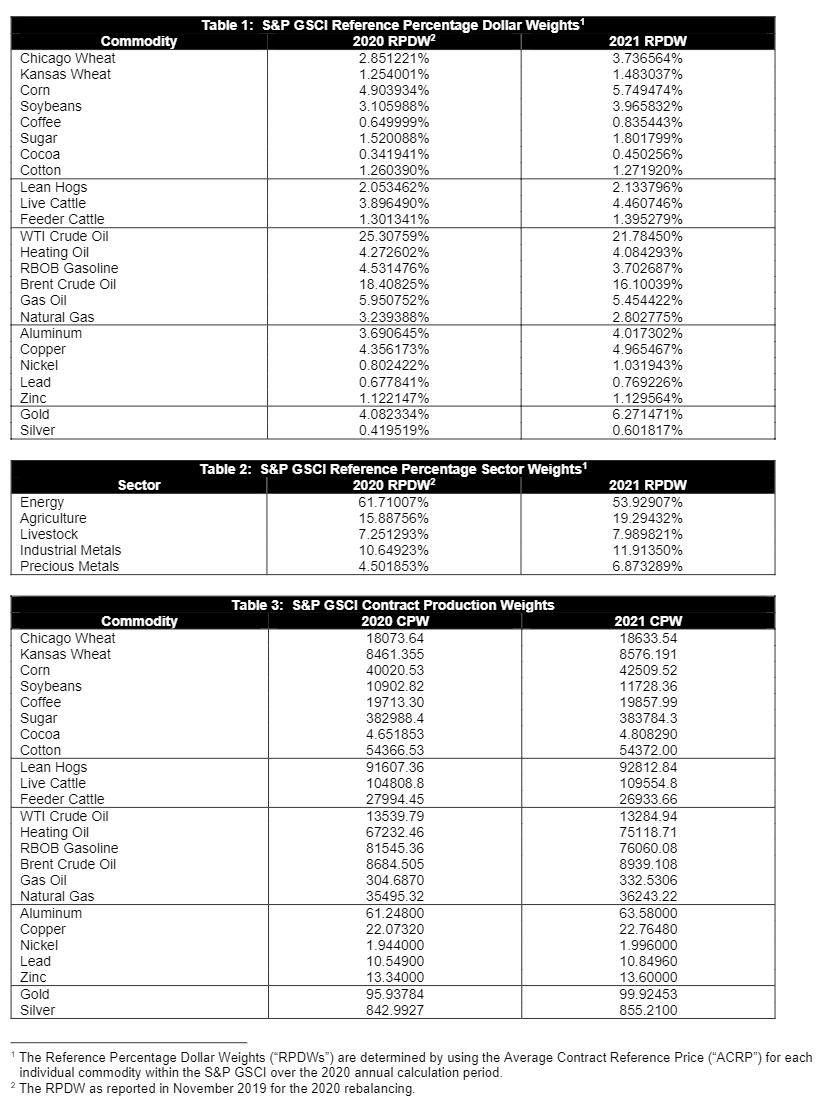
The table below shows the exact breakdown and weights for the various futures contracts per sector. This image comes from S&P Dow Jones Indices, which publishes the new composition and weightings every year. If you click on the table, you will be taken to the complete document.
The five sectors in the index lend themselves very well for plotting on a Relative Rotation Graph. You can easily load this RRG from the predefined groups in the drop-down selection,
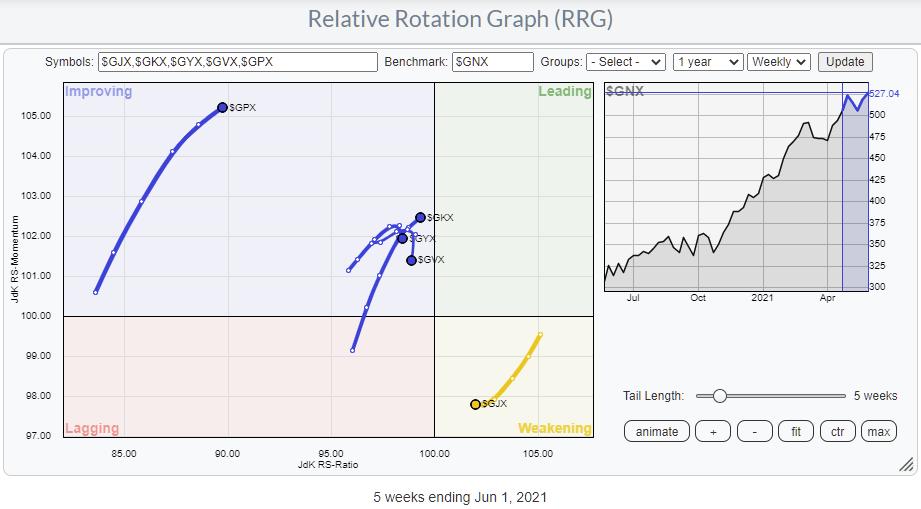
A few takeaways from this graph. First of all, it is very clear that $GJX (Energy) is the biggest weight. $GJX is alone inside the weakening quadrant and it needs all other sectors to be inside the improving quadrant. Within improving, Industrial Metals and Livestock tails are rolling over and gradually starting to move back down to the lagging quadrant. Precious Metals are still at a positive heading, but far to the left and very slowly starting to lose relative momentum, which probably makes it hard for this sector to reach leading in this rotational sequence.
Energy
Energy, inside weakening, has started to slow down on the momentum scale and the week-to-week observations are getting closer (lower RRG-Velocity), which increases the odds for a rotation back up to leading without going through lagging.
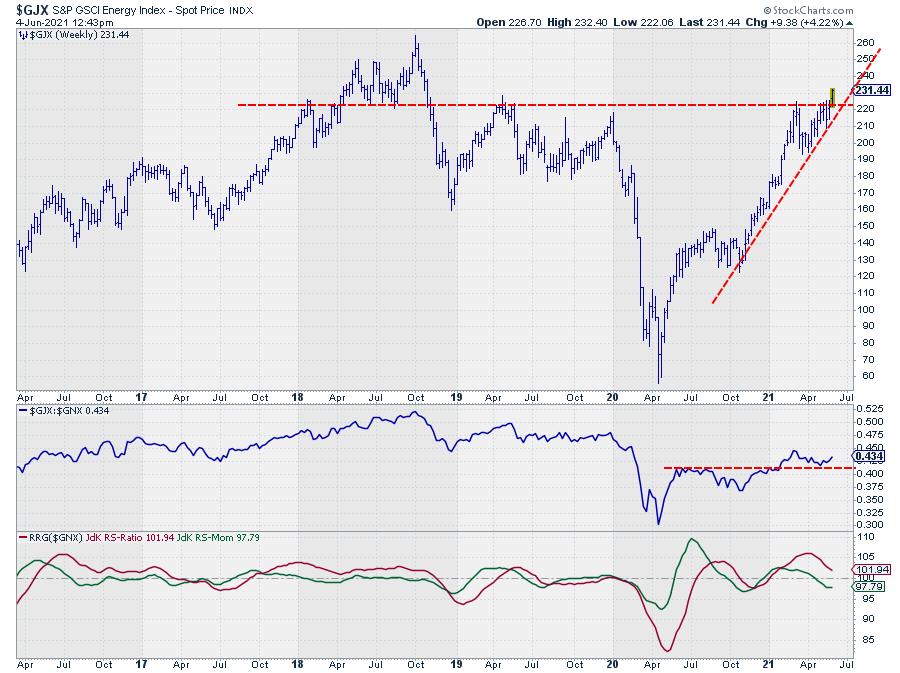
The price chart is confirming the underlying strength for Energy, as it just broke above the horizontal barrier around 220. This is opening up the way for more upside, which will definitely fuel a further improvement of relative strength (which already broke above its resistance at the start of the year and recently formed a new low around that breakout level).
Agricultural
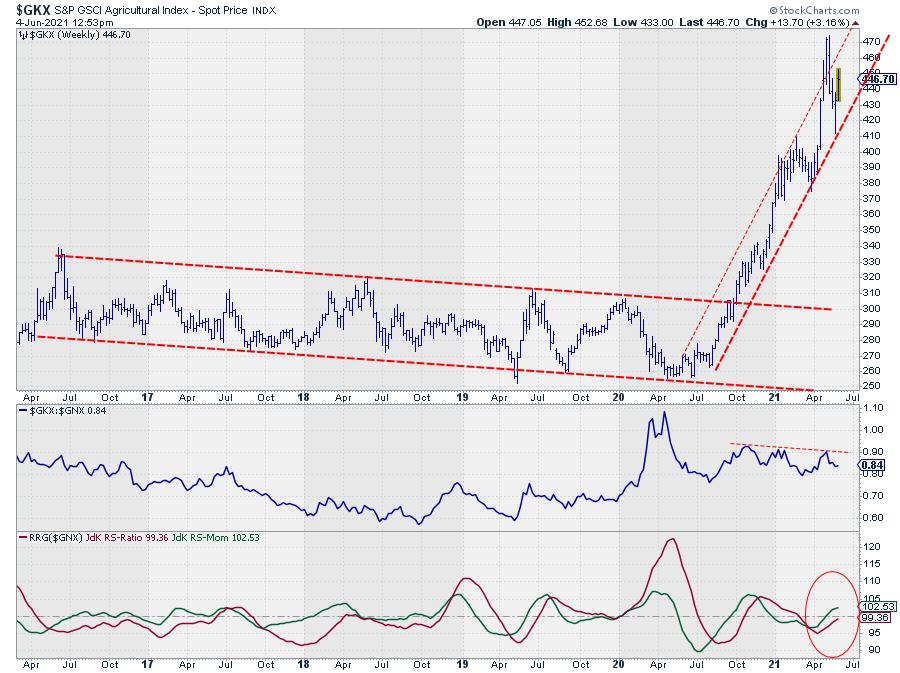
The Agricultural sector is showing a long and strong tail inside the improving quadrant, close to crossing over into leading. The recent slow down on the JdK RS-Momentum scale is the result of the bounce-off, off resistance in the RS-line.
At first sight, the steepness of the rising channel on the price graph could be cause for concern. A break out of that channel could open up significant downside risk.
However, turning to the long-term monthly chart for this sector shows that we have just crossed above a major high that was set in 2014 near 425, which most likely will now start to serve as support.
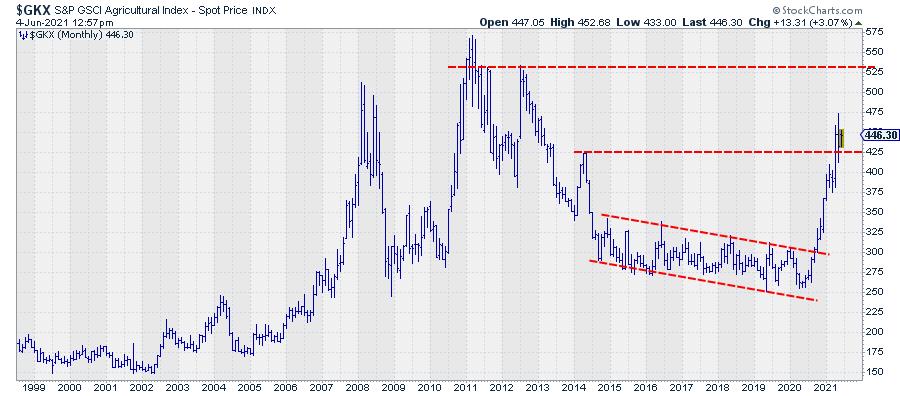
So, even if $GKX would break its steep channel on the weekly chart, there will still be support offered around 425.
Especially when $GNX can pick up relative strength again in the coming weeks and move beyond the overhead resistance in relative strength, further outperformance may be expected for this sector.
#StaySafe and enjoy your weekend, --Julius
My regular blog is the RRG Charts blog. If you would like to receive a notification when a new article is published there, simply "Subscribe" with your email address
Julius de Kempenaer
Senior Technical Analyst, StockCharts.com
Creator, Relative Rotation Graphs
Founder, RRG Research
Host of: Sector Spotlight
Please find my handles for social media channels under the Bio below.
Feedback, comments or questions are welcome at Juliusdk@stockcharts.com. I cannot promise to respond to each and every message, but I will certainly read them and, where reasonably possible, use the feedback and comments or answer questions.
To discuss RRG with me on S.C.A.N., tag me using the handle Julius_RRG.
RRG, Relative Rotation Graphs, JdK RS-Ratio, and JdK RS-Momentum are registered trademarks of RRG Research.


