The S&P 500 is going higher. If you knew nothing else about the current market environment, you would consider that to be a bullish indication. As Paul Montgomery once said, "The most bullish thing the market can do is go up."
But if you look underneath the hood, you'll see the breadth measures are mixed to negative. Advancers-decliners are not confirming this week's new all-time highs on the major averages. Only 56% of the S&P members are above their 50-day moving averages. And the equal-weighted S&P is underperforming the cap-weighted S&P.
What does all the above mean? This is a narrowly led market driven by large cap growth stocks. The real question is, does it matter?
Let's review each of these three charts, talk about the current configuration and what we would need to see for a more bullish breadth picture. First, we have the cumulative advance-decline lines of the NYSE (common stock only), the S&P large-cap, mid-cap and small-cap indices.
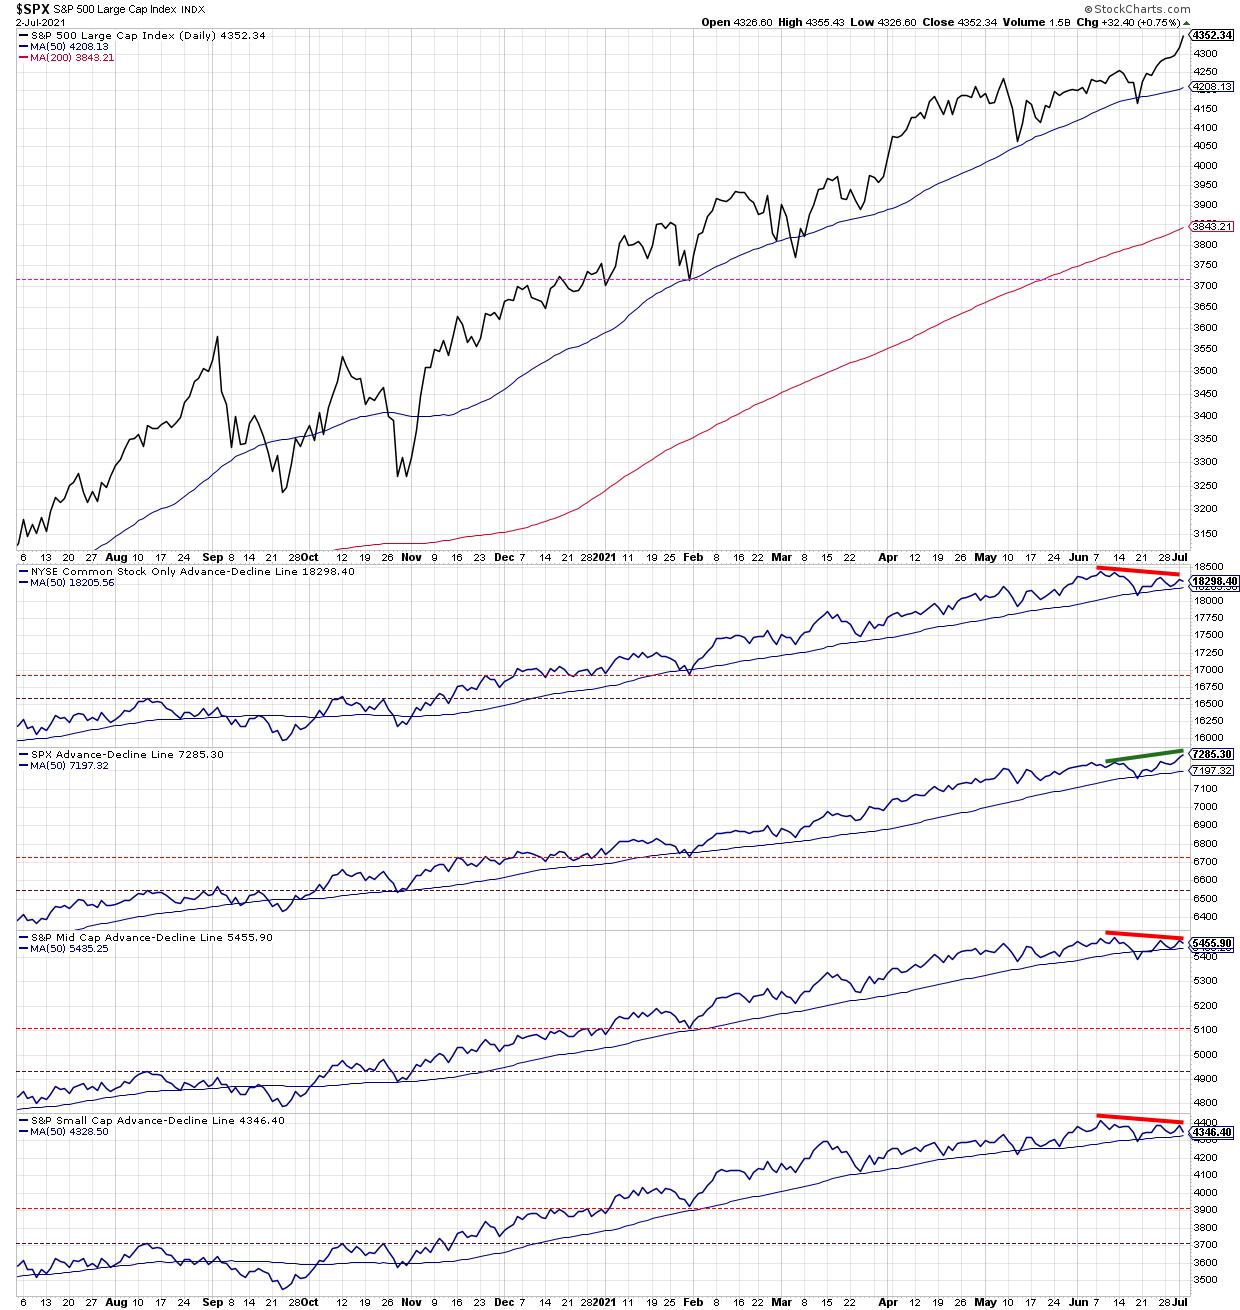
Only one of the four advance-decline lines has confirmed this week's new highs, and that's the one for the S&P 500 itself. That means that for mid-caps, small-caps and the broad NYSE common stock universe, we have made lower highs in terms of breadth. This suggests that while large-caps are pushing higher, lower-cap tiers are not participating in the most recent upswing.
What would cause this chart to turn more bullish? The other A-D lines would need to confirm new highs. Then the bearish divergence would be alleviated, and we would have a bullish confirmation.
Second, we have the percent of stocks above their key moving averages.
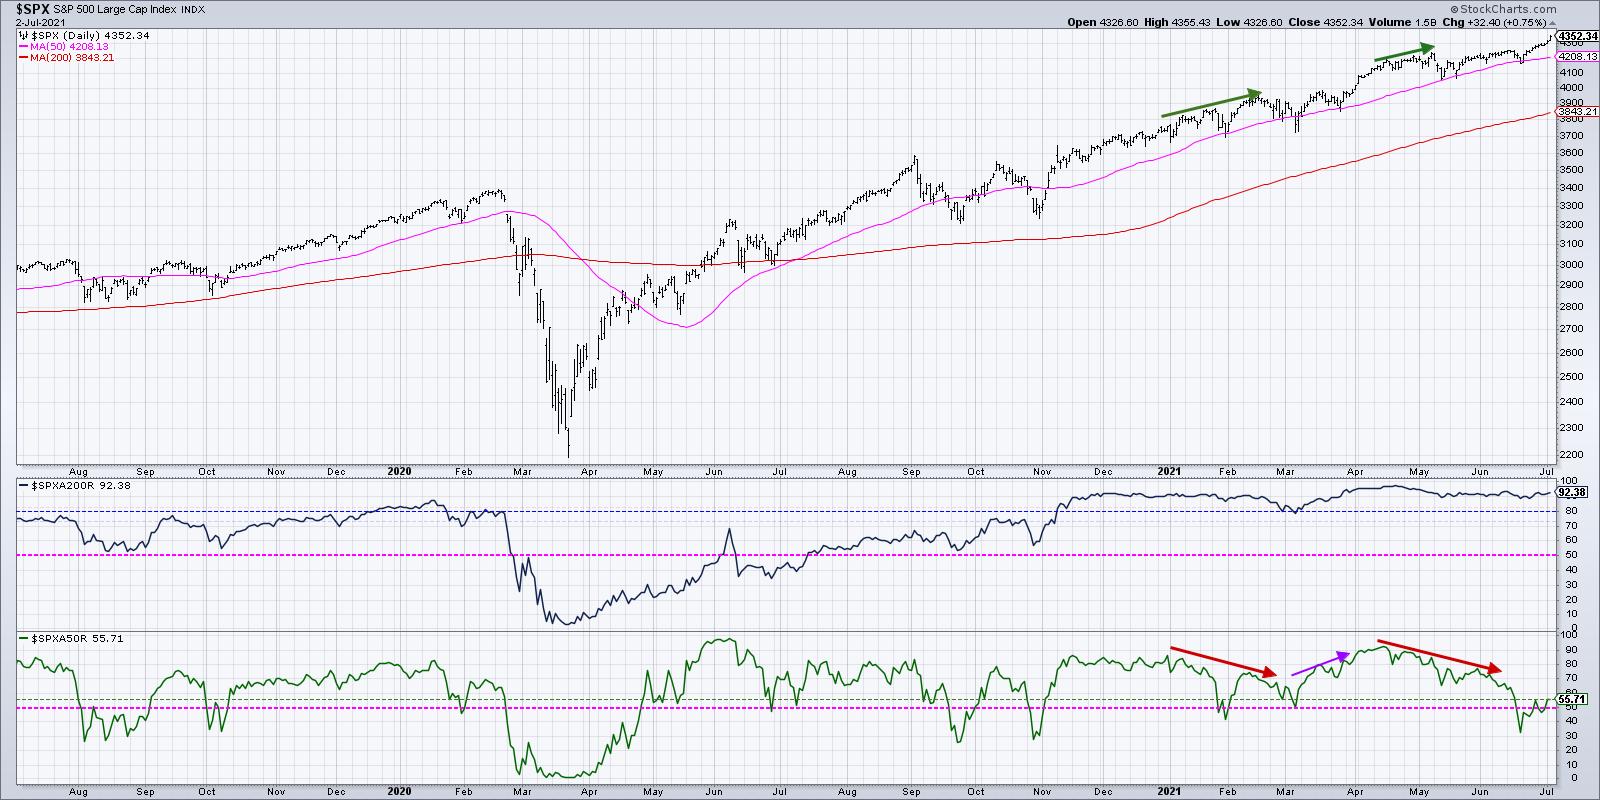
When the S&P made new all-time highs in April, about 92% of the S&P 500 members were above their 50-day moving average. The current reading is around 56%. In mid-June, that value was down around 32%. To put another way, a full 60% of the S&P 500 members broke their 50-day moving average from April to June. Since then, just under half of those breakdown names have recovered back above their 50-day.
Conclusion: many stocks have broken down and not yet recovered, even as the S&P and Nasdaq have pushed to new highs.
What would create a more bullish thesis on this chart? We would need to see continued increase in the number of stocks above their 50-day moving average. Given that most of the growth areas of the S&P have already done so, that would mean the cyclicals would need to rotate back above their 50-day and resume their uptrends.
Finally, we have the equal-weighted S&P versus the cap-weighted S&P.
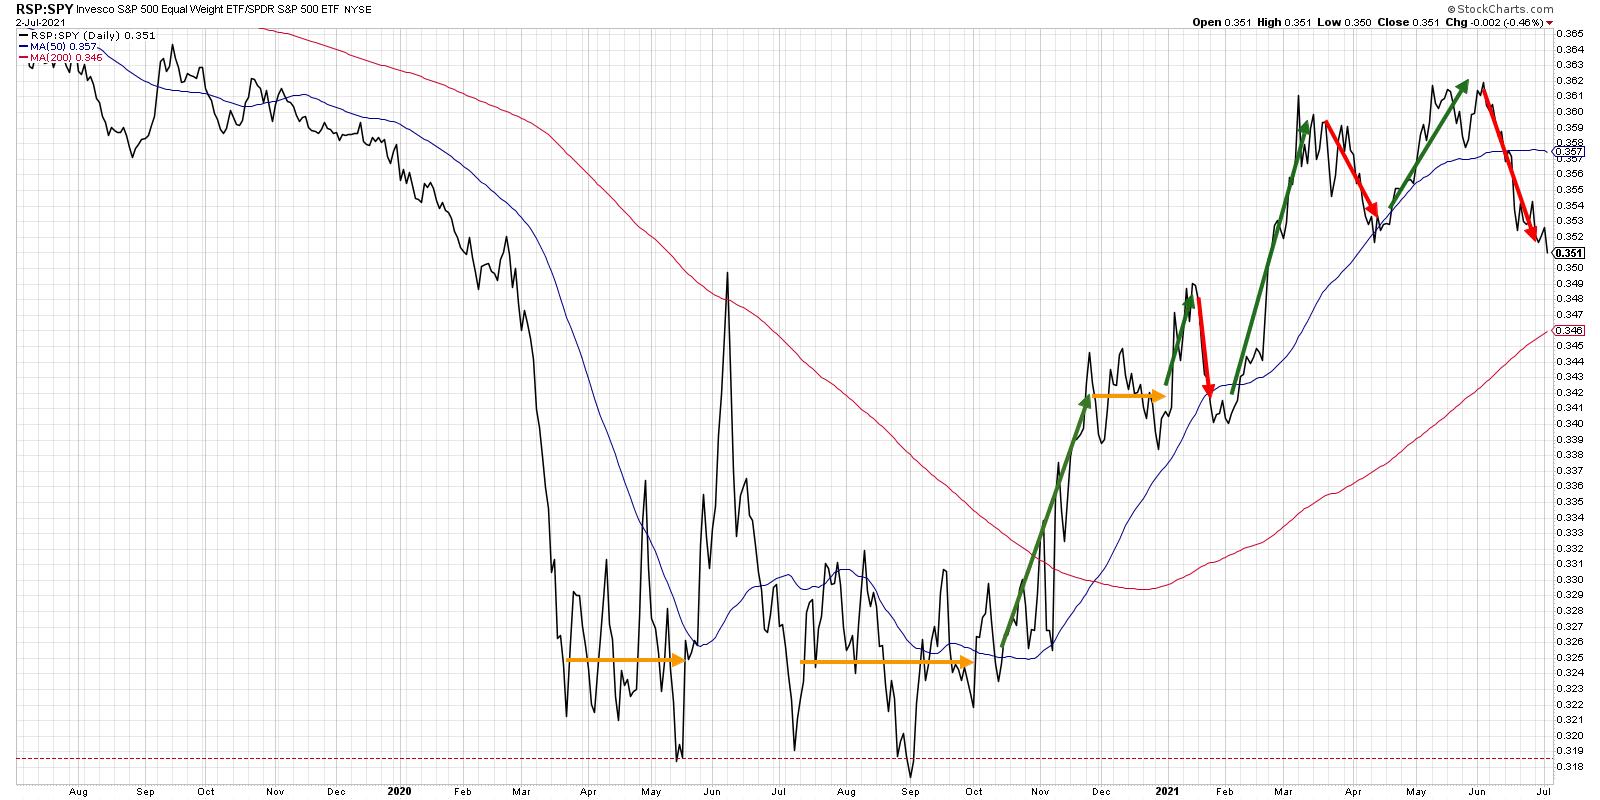
Just to review, the S&P 500 index is market cap-weighted, which means larger market cap stocks have a proportionally larger weight in the index. The equal-weighted S&P, on the other hand, treats each of the 500 stocks with the same weight. Most breadth measures, including the two we've discussed previously, are all equal-weighted indicators.
This ratio made a new high in early June but has since rotated much lower, as the S&P 500 has rallied higher more based on the strength of mega cap stocks like the FANMAG names. The ratio going lower on its own is not necessarily bearish, as it more describes the nature of leadership and where the strength is really coming from. But, in general, the market going higher with this ratio going lower tends to be a sign that many stocks are breaking down, even if the market itself is going higher.
Notice the downtrend in this ratio leading up to the 2020 market top, when the FANMAG stocks were driving the market onward and ever upward! This ratio turning higher, ideally confirming new price highs for the S&P 500, would certainly indicate more of a broad advance, with the mid-cap members of the S&P 500 participating in the market upswing.
So now, for the most important question: how much do all of the breadth readings matter, if the market continues to push higher?
The answer is that breadth really means participation. The indexes moving higher on weaker breadth suggest that there are less stocks participating in the up move. But it also means that the move is higher, and enough of the largest stocks are able to bring the entire market along for the ride.
The current situation reminds me to follow the trends (currently up), focus on risk management for charts breaking down (for example, airlines and cruise lines) and remember that the trend is your friend until the uptrend is exhausted!
RR#6,
Dave
P.S. Ready to upgrade your investment process? Check out my free course on behavioral investing!
David Keller, CMT
Chief Market Strategist
StockCharts.com
Disclaimer: This blog is for educational purposes only and should not be construed as financial advice. The ideas and strategies should never be used without first assessing your own personal and financial situation, or without consulting a financial professional.
The author does not have a position in mentioned securities at the time of publication. Any opinions expressed herein are solely those of the author, and do not in any way represent the views or opinions of any other person or entity.


