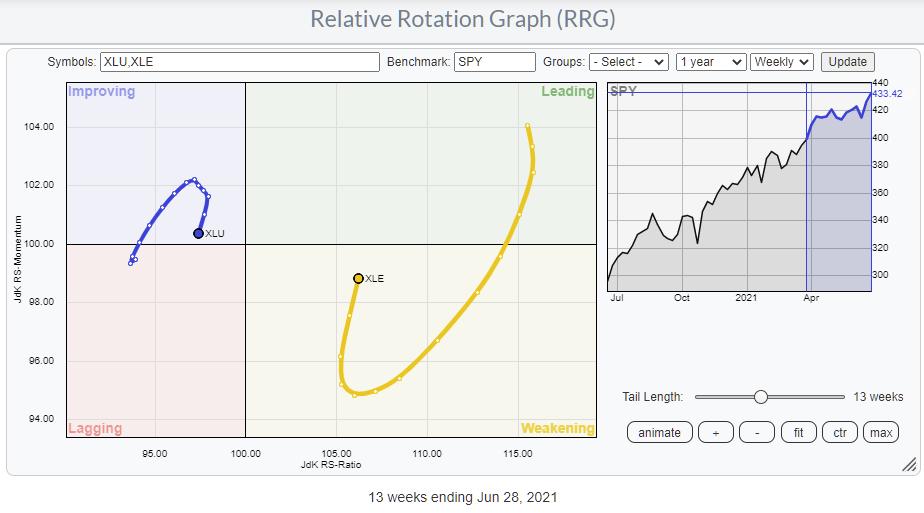
On the Sector RRG, the tails for Energy and Utilities stand out. The Utilities sector is positioned inside the improving quadrant, but started rolling over a few weeks ago and is now heading towards the lagging quadrant again. On the opposite side, Energy is inside the weakening quadrant, but is already heading back towards the leading quadrant. Both sectors seem to be embarking on a new leg in their respective relative trends; Energy upward, Utilities downward against the S&P.
The Groups
From the sector RRG, we can step down one level and look at the groups within those sectors.
UTILITIES
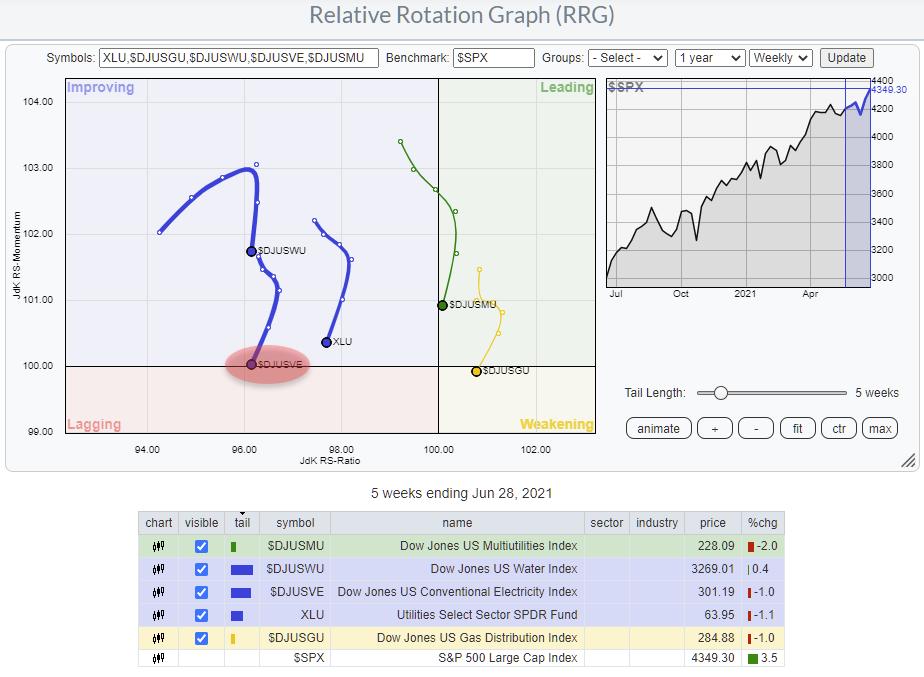 The Utilities sector consists of four groups, as seen in the RRG above. The benchmark for the RRG is $SPX, and XLU (the Utilities sector ETF) is included as a reference for the sector vs. $SPX.
On this RRG, the tail for Conventional Electricity ($DJUSVE) is about to rotate back into the lagging quadrant, making it the weakest group in (probably) the weakest sector, which is about to embark on a new leg down in an already established relative downtrend.
ENERGY
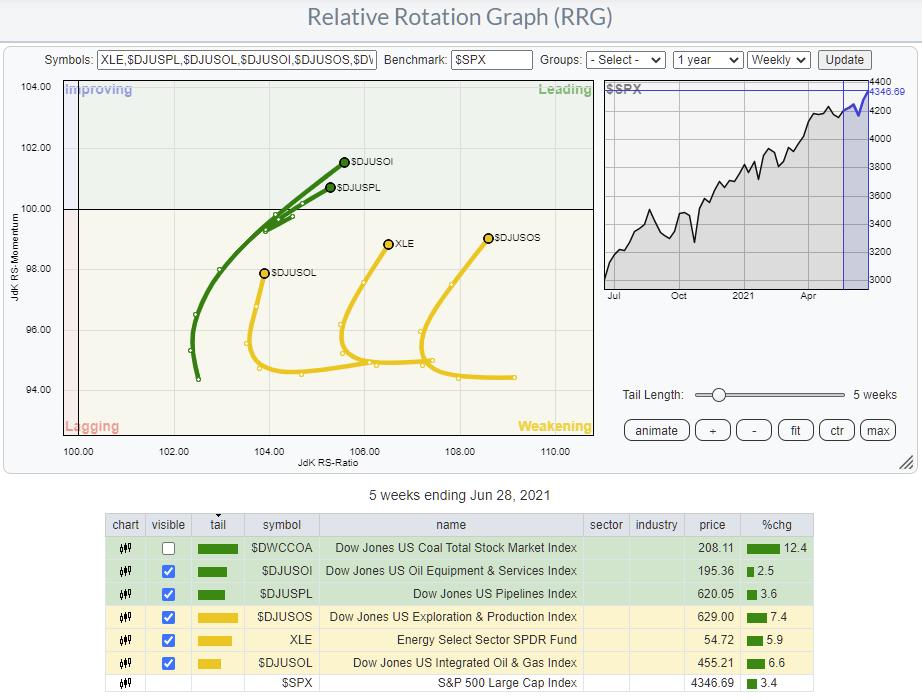
The Energy sector has five groups, as you can see in the table below the RRG. I have taken off the tail for Coal, as that group holds no stocks that are also inside the S&P 500. This leaves us with four groups on the RRG.
Using the same approach, we can identify the Exploration & Production Index as interesting because of its rotation back up towards the leading quadrant while inside weakening.
The Stocks
US Exploration & Production Index
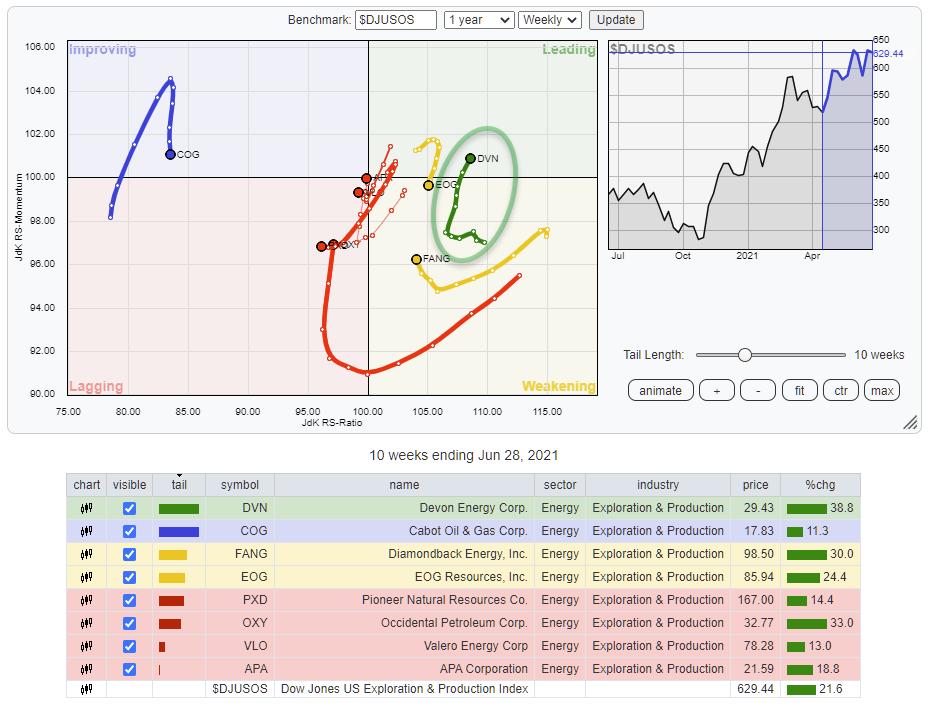
This group holds eight stocks that are plotted on the RRG above against their group index $DJUSOS. One stock that really stands out in terms of rotation is DVN, Devon Energy Corp. DVN just returned back inside the leading quadrant at a strong RRG-Heading after having rotated through the weakening quadrant.
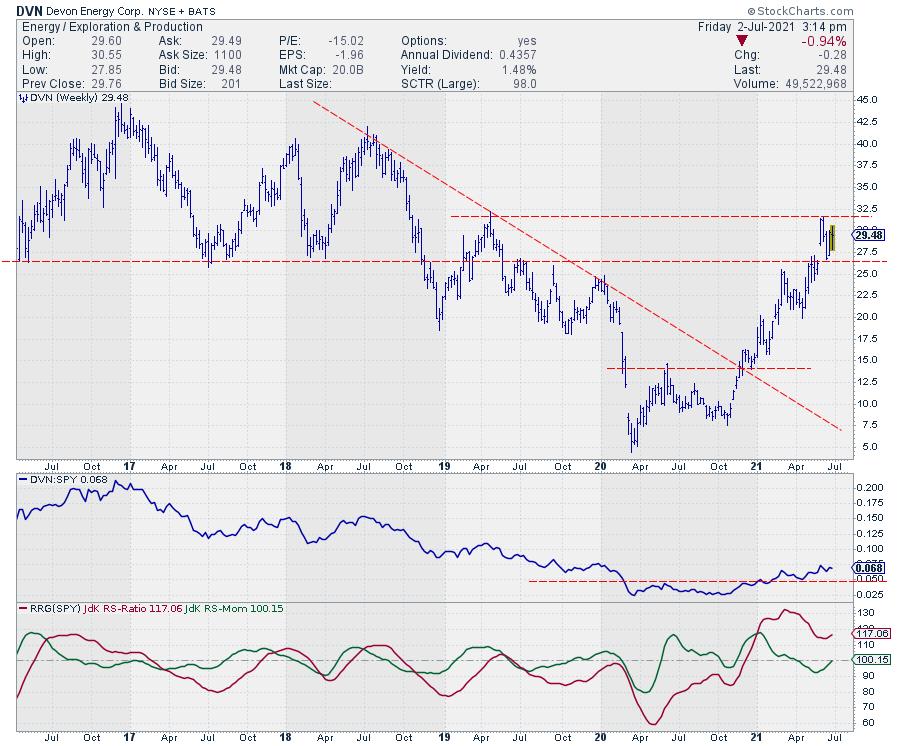
DVN started to trade higher in a new series of higher highs and higher lows at the end of 2020, when it broke a multi-year falling resistance line and, at the same time, completed a bottom formation in Relative Strength. That resulted in both RRG-Lines crossing above the 100-line and pushing DVN into the leading quadrant. After the initial break in RS, the consolidation and test of former resistance as support led to a rotation through the weakening quadrant, which is now about to get completed and bring DVN back into leading.
In terms of price, overhead supply is expected just below $32.50. Once that can be cleared upwardly, there is very little resistance left until the 2018 highs near $40.
Conventional Electricity Index
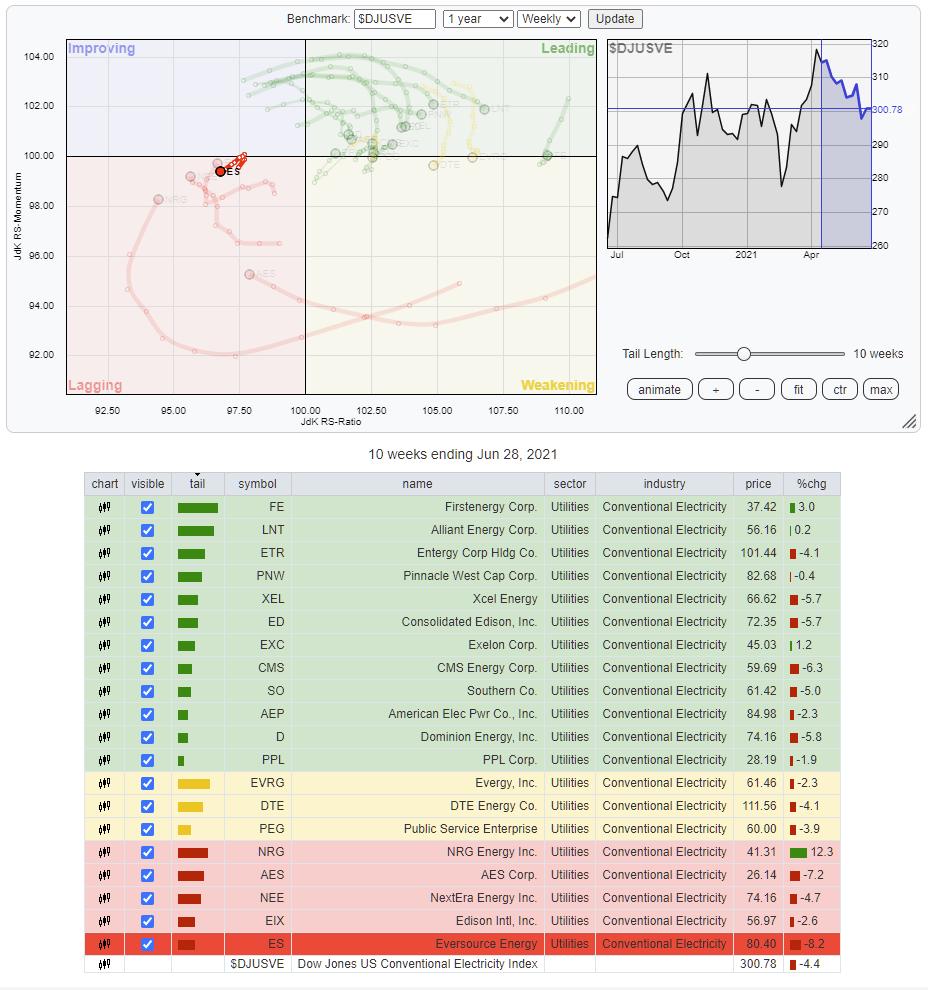
Conventional Electricity is a fairly large group with 20 constituents. On the RRG above, they are plotted against their group index $DJUSVE. I have isolated one tail because it would otherwise be hard to see. But ES, Eversource Energy, jack-knifed back into the lagging quadrant after a short move higher on the JdK RS-Momentum axis. The short tail, in comparison with the other stocks on the graph, indicates that it is a very stable relative downtrend.
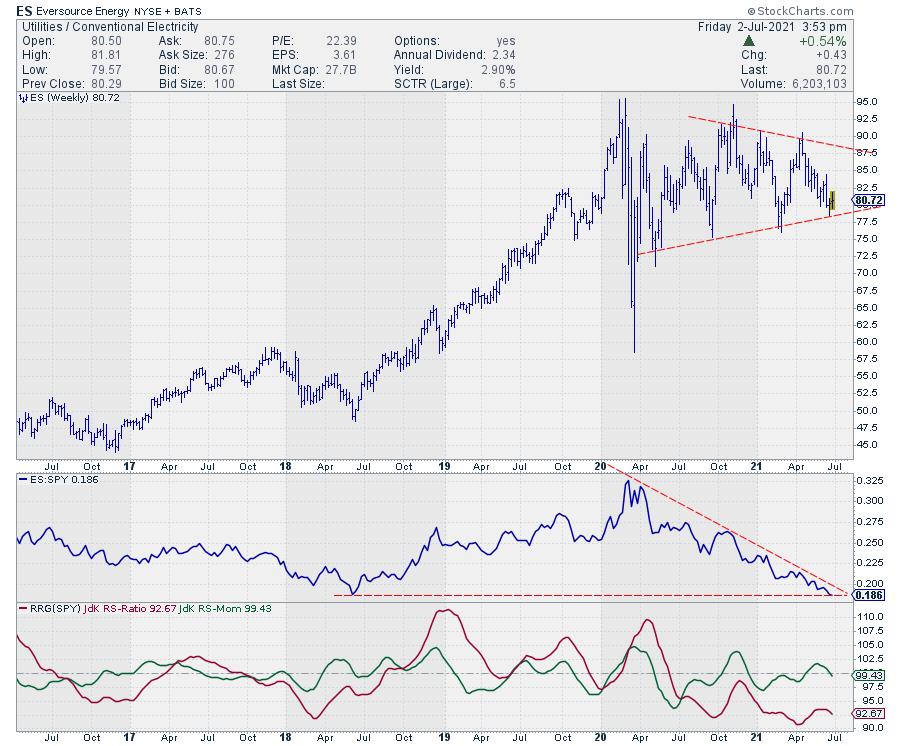
After the big high-low swing at the start of 2020, ES ended up in a broad consolidation. What is more relevant for this analysis is the consistent downtrend in relative strength, which is about to break below its 2018 low. A downward break out of that big consolidation on the price chart will very likely cause an acceleration lower in both price and relative strength. That makes ES a very weak stock, in a weak group in a weak sector...
#StaySafe and have a great weekend, --Julius
My regular blog is the RRG Charts blog. If you would like to receive a notification when a new article is published there, "Subscribe" with your email address.
Julius de Kempenaer
Senior Technical Analyst, StockCharts.com
Creator, Relative Rotation Graphs
Founder, RRG Research
Host of: Sector Spotlight
Please find my handles for social media channels under the Bio below.
Feedback, comments or questions are welcome at Juliusdk@stockcharts.com. I cannot promise to respond to each and every message, but I will certainly read them and, where reasonably possible, use the feedback and comments or answer questions.
To discuss RRG with me on S.C.A.N., tag me using the handle Julius_RRG.
RRG, Relative Rotation Graphs, JdK RS-Ratio, and JdK RS-Momentum are registered trademarks of RRG Research.


