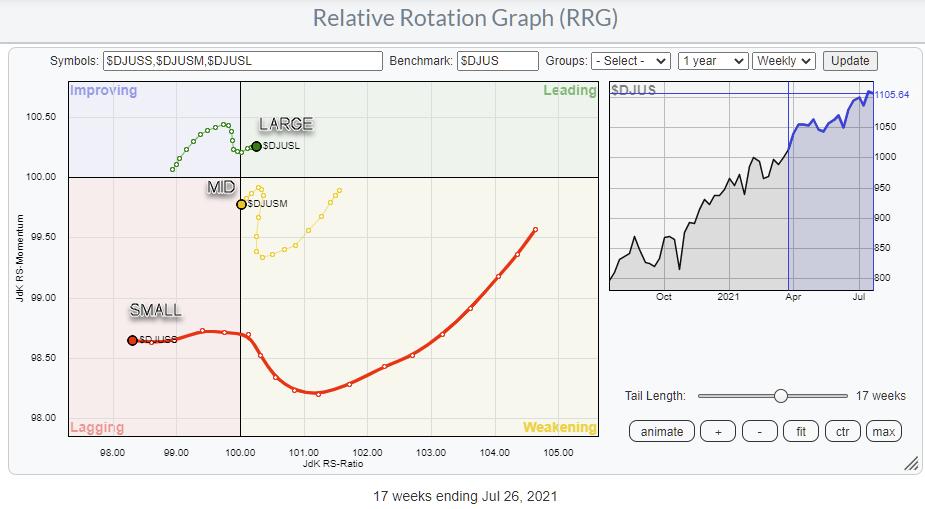
The Relative Rotation Graph showing the rotations for Large-, Mid- and Small-Cap indexes is sending a very clear message: Avoid Small-Caps. (And also Mid-Caps.)
The large-cap segment pushes further into the leading quadrant, while small-caps are on a very long tail moving deeper into negative territory. It looked as if the tails for mid- and small-caps were curling back up and on their way towards the leading quadrant for a continuation of their relative uptrend during May and June. Meanwhile, large-caps were rolling over inside, improving and heading back towards lagging.
That situation changed 4-5 weeks ago, when small-caps rapidly started accelerating towards and into the lagging quadrant, followed by mid-caps. At the same time, large-caps picked up the pace again and now crossed over into the leading quadrant.
Although it is not a "hard rule," it is generally a weak sign for the market when Small-Caps (rapidly) deteriorate. In bull markets, investors are happy to invest in small-caps looking for the next 10- or 100-bagger. However, when the going gets tough, many of them revert to well-known, usually large- or even mega-cap names, as a "safe haven."
Growth-Value
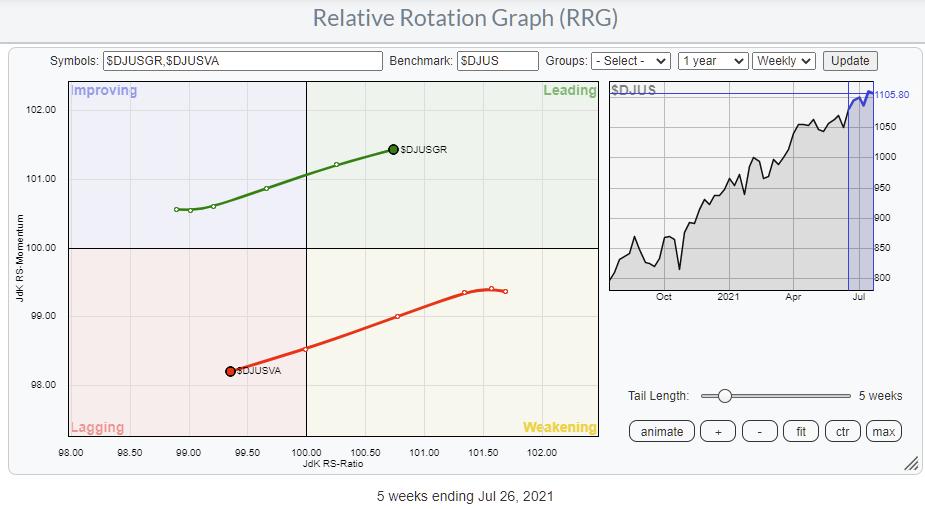
The Growth-Value relationship is sending a conflicting message at the moment. Since the start of 2021, the DJ US Value index has moved on the right-hand side of the RRG (and the Growth index), indicating a preference for Value stocks. In general, that is a situation that is considered "weak" for the general markets, as big rallies are mostly carried by the performance of growth stocks.
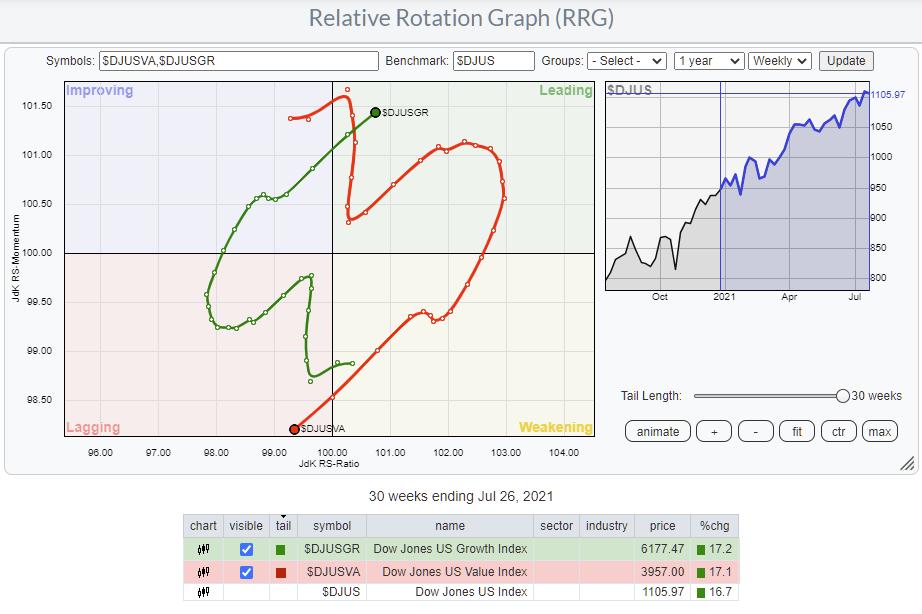
If we extend the tails out to the maximum of 30-weeks, we see that the actual difference in performance between these two segments is negligible, 17.2% vs. 17.1%. So we have to conclude that the relative trend for Value was only marginally better during that entire period. Only in the first few months of the year was Value really in much better shape than Growth, but the latter has caught up rapidly, and both are now at very similar performance levels.
Given that SPY managed to add similar gains over the same period, there was not much Alpha to be gained by playing either Growth or Value unless you switched at the end of May.
Breaking Growth and Value Down Into Sizes.
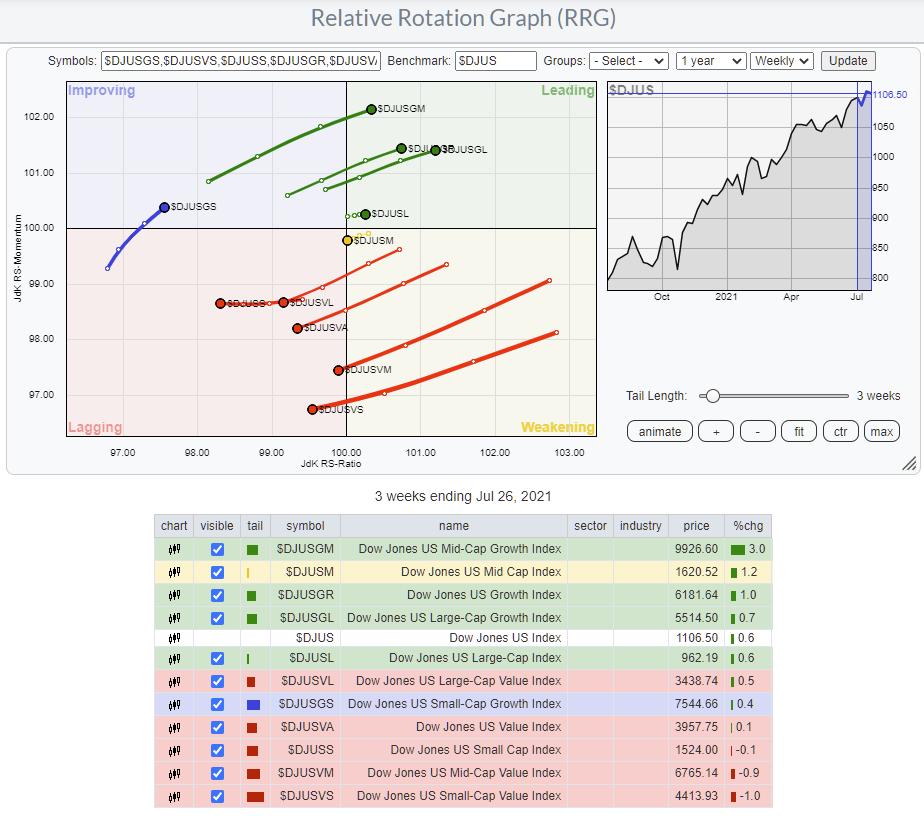
Combining both of these RRGs into one gives the image above. This chart holds the Growth and Value indexes and the Size indexes of the previous RRGs above. But it also adds the large-, mid- and small-cap segments for Growth and Value, which gives a much more granular view on where the relative performance is found in the market.
Looking in the table below the RRG, you can see that the red lagging quadrant is dominated by the small-cap index and all sizes of the Value segment. The green, leading quadrant holds the large-cap and the growth indexes and both the mid- and large-cap Growth variants. The only growth index missing is the small-cap growth index, which is far away to the left, just inside the improving quadrant but at the lowest RS-Ratio reading. This tells me that the small-cap component of the Growth segment is lagging the general improvement visible for Growth in general.
Small-caps and Small-Cap Value are inside lagging and heading lower on both axes. On the other hand, Small-Cap Growth is inside improving, but at the lowest RS-Ratio level, which means that there is a decent chance that the tail will roll over before hitting the leading quadrant.
All in all, a pretty negative reading for the entire small-cap universe. As long as that situation continues, I remain on my guard concerning the ability of SPY to move considerably higher. The current (imho) risk does not outweigh the upside potential at the moment.
#StaySafe and have a great weekend, --Julius
My regular blog is the RRG Charts blog. If you would like to receive a notification when a new article is published there, "Subscribe" with your email address.
Julius de Kempenaer
Senior Technical Analyst, StockCharts.com
Creator, Relative Rotation Graphs
Founder, RRG Research
Host of: Sector Spotlight
Please find my handles for social media channels under the Bio below.
Feedback, comments or questions are welcome at Juliusdk@stockcharts.com. I cannot promise to respond to each and every message, but I will certainly read them and, where reasonably possible, use the feedback and comments or answer questions.
To discuss RRG with me on S.C.A.N., tag me using the handle Julius_RRG.
RRG, Relative Rotation Graphs, JdK RS-Ratio, and JdK RS-Momentum are registered trademarks of RRG Research.


