After leading the market into February 2020, tech-related ETFs were hit with strong selling pressure into March and extended their corrections into May. Large triangles formed in several and they broke out of these bullish continuation patterns with strong move the last seven weeks. A triangle within an uptrend represents a rest within that uptrend and it is considered a bullish continuation pattern. The breakouts, therefore, signal an end to the consolidations and a resumption of the bigger uptrends.
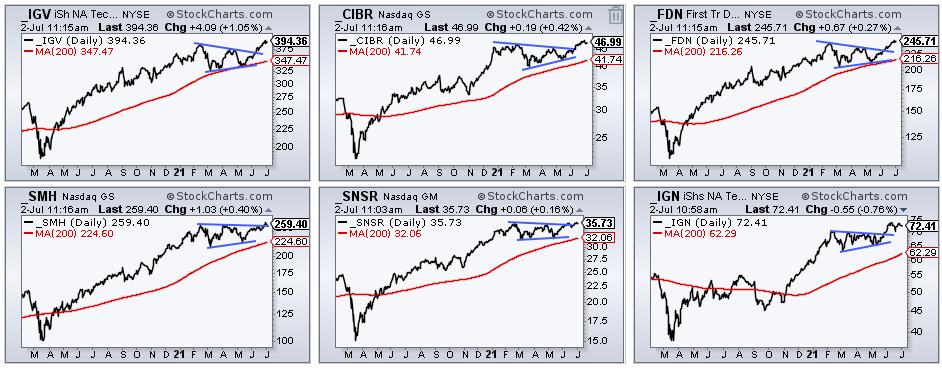
As the image above shows, there were triangle breakouts in the Software ETF (IGV), the Cyber Security ETF (CIBR), the Internet ETF (FDN), the Semiconductor ETF (SMH) , the Internet of Things ETF (SNSR) and the Networking ETF (IGN). These five ETFs also recorded new highs in June. Throw in new highs in the Technology SPDR (XLK) and Nasdaq 100 ETF (QQQ), and it is clear that tech-related stocks and ETFs are leading the market.
While the big triangle breakouts and new highs are long-term bullish, note that some of these ETFs are quite extended short-term. Of course, keep in mind that it takes strong upward momentum to become extended and this is more bullish than bearish. Trend-followers and momentum players usually don't worry about overbought conditions. Some traders may, however, wish to keep the powder dry and wait for a tradable pullback. The chart below shows IGV with a 19.5% gain since mid May and RSI above 70. Long-term strong and short-term extended.
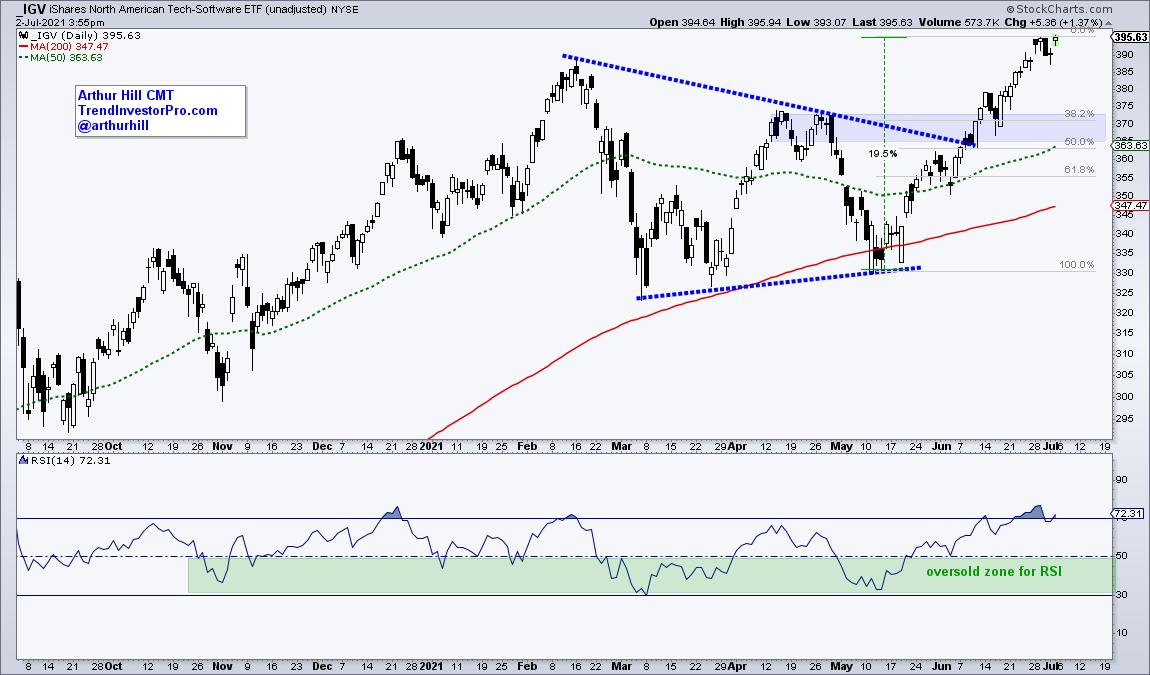
Chartists looking for an area of support after a pullback can focus on three things. First, the breakout zone turns into the first support zone to watch on a pullback. Second, it is not uncommon to see a pullback that retraces one to two thirds of the prior advance. A 38.2-50 percent retracement of the 19.5% advance would extend to the 363-373 area. Third, the rising 50-day SMA comes into play around 363. Taken together, a pullback into the 365-370 area could offer a second chance to partake in this uptrend. We, the royal "we" that is, at TrendInvestorPro.com will be watching these ETFs in the coming weeks and months. Also check out our favorites books (here).
---------------------------------------------------
Choose a Strategy, Develop a Plan and Follow a Process
Arthur Hill, CMT
Chief Technical Strategist, TrendInvestorPro.com
Author, Define the Trend and Trade the Trend
Want to stay up to date with Arthur's latest market insights?
– Follow @ArthurHill on Twitter


