After months of quiet frustrating trading, Bitcoin finally broke out to the upside this week. It's too early to say whether this is the beginning of a move to new all-time highs, as lots more backing and filling is probably necessary in order for it to form a nice base to counterbalance the recent decline. However, it does appear likely that it will stay clear of the high $28k-30k zone for some time.
The Big Breakout
Let's go back to last October, when the price broke out from its 2018-2020 inverse head-and-shoulders pattern. Chart 1 shows that the indicated upside objective was quickly achieved, so it could be argued that the base has completed its work as a platform for price gains and the early 2021 price action will turn out to be a top. However, when you study pauses in other bubble-type markets, breakouts from similar formations usually support a much more extensive rally timewise than has currently been the case.
Right now, things look promising, as the price has bounced from a point where it should have found support, which is its 65-week EMA. In addition, the recent severe decline did cause the long-term KST to stabilize, but was not sufficient to push it to the downside. Both of these long-term indicators therefore remain in the bullish camp.
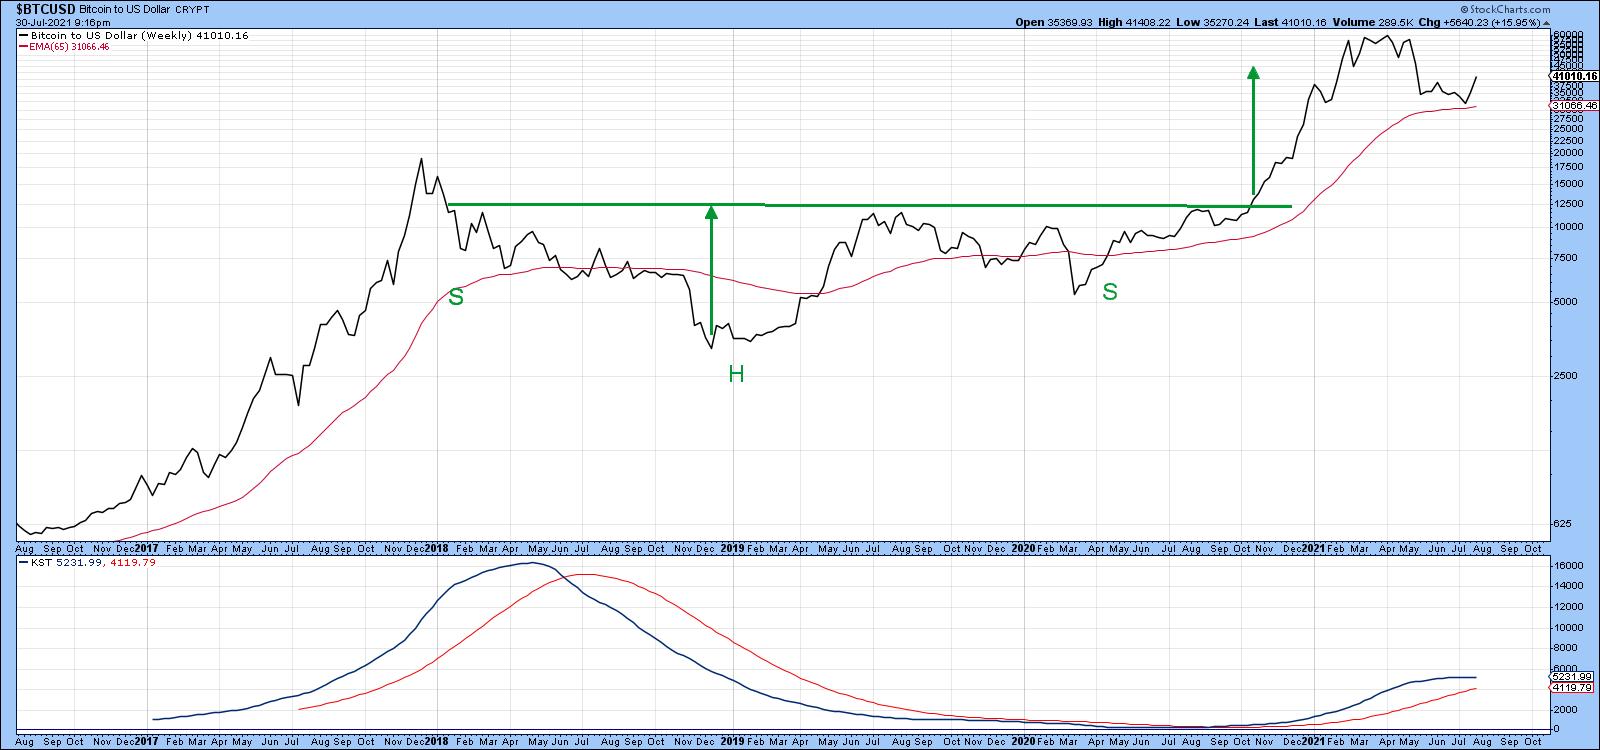 Chart 1This Week's Breakout
Chart 2 shows recent action in greater detail. First, a selling climax developed in mid-May. This was followed by a whipsaw break to the downside in mid-June. However, it was never confirmed by a positive trendline penetration or MA. A second whipsaw developed at the start of last week. This one, though, has been confirmed. That confirmation took the form of a break above the dashed green down trendline and 50-day MA. Volume started to kick in with Monday's sharp rally, which is also a positive sign.
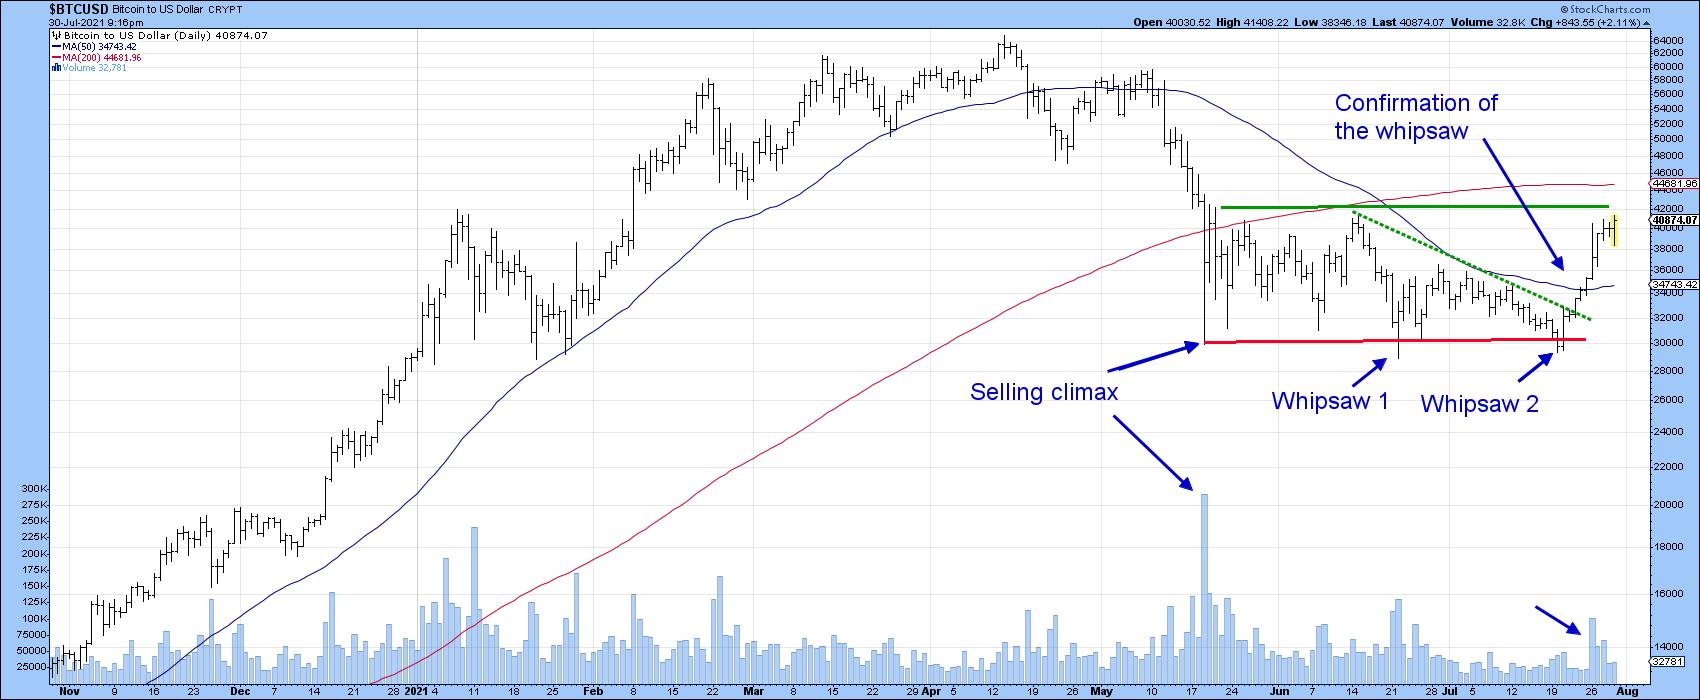 Chart 2Resistance, first of all, exists at the June high at $42,000 and, second, in the area of the 200-day line at around $44,000. Usually, a confirmed whipsaw or false break is followed by an above-average move in the opposite direction to the break. That occurs because many traders bet on the false signal and are forced to quickly get back on the right side of the market. In this case, it could be attributed to traders who incorrectly interpreted the post-May action as a bearish continuation head-and-shoulders formation.
Higher prices look likely over the near-term as the short-term KST, featured in Chart 3, has only just gone bullish. The chart indicates that, during a strong bull run, signals 1-7 were each followed by healthy gains. Signals 8-10 developed during the mini-bear market and were not successful. The current one is likely to do well since the price was recently at a marginal new closing low and the KST at a much higher level than its June bottom. This positive divergence has been flagged with the two dashed-green arrows.
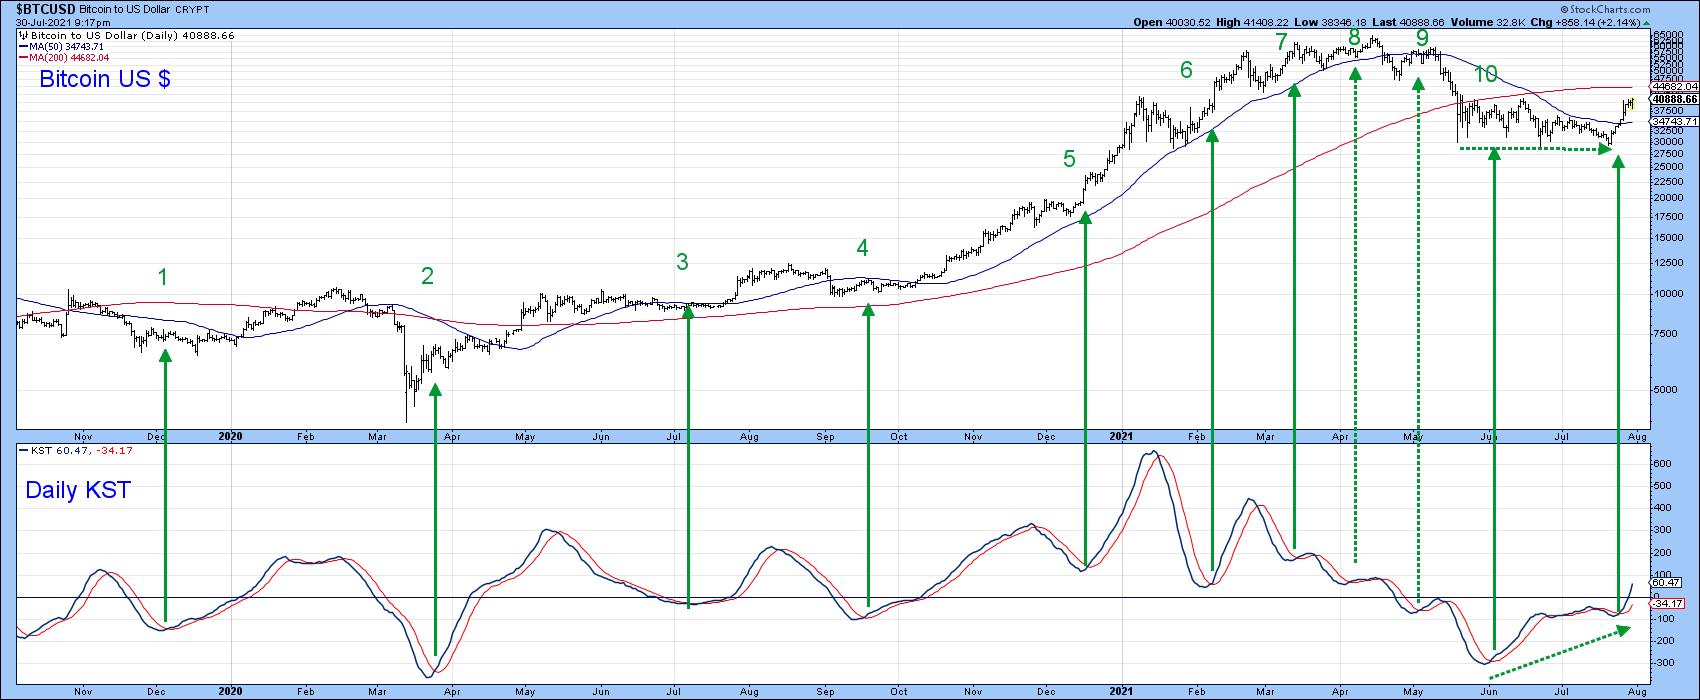 Chart 3Charts 4-6 of differing cryptocurrencies show that the current rally is broadly based, as Monero, Litecoin and Etherium have all broken to the upside. Etherium is of particular interest because it is already above its 200-day MA, unlike the rest, which are not.
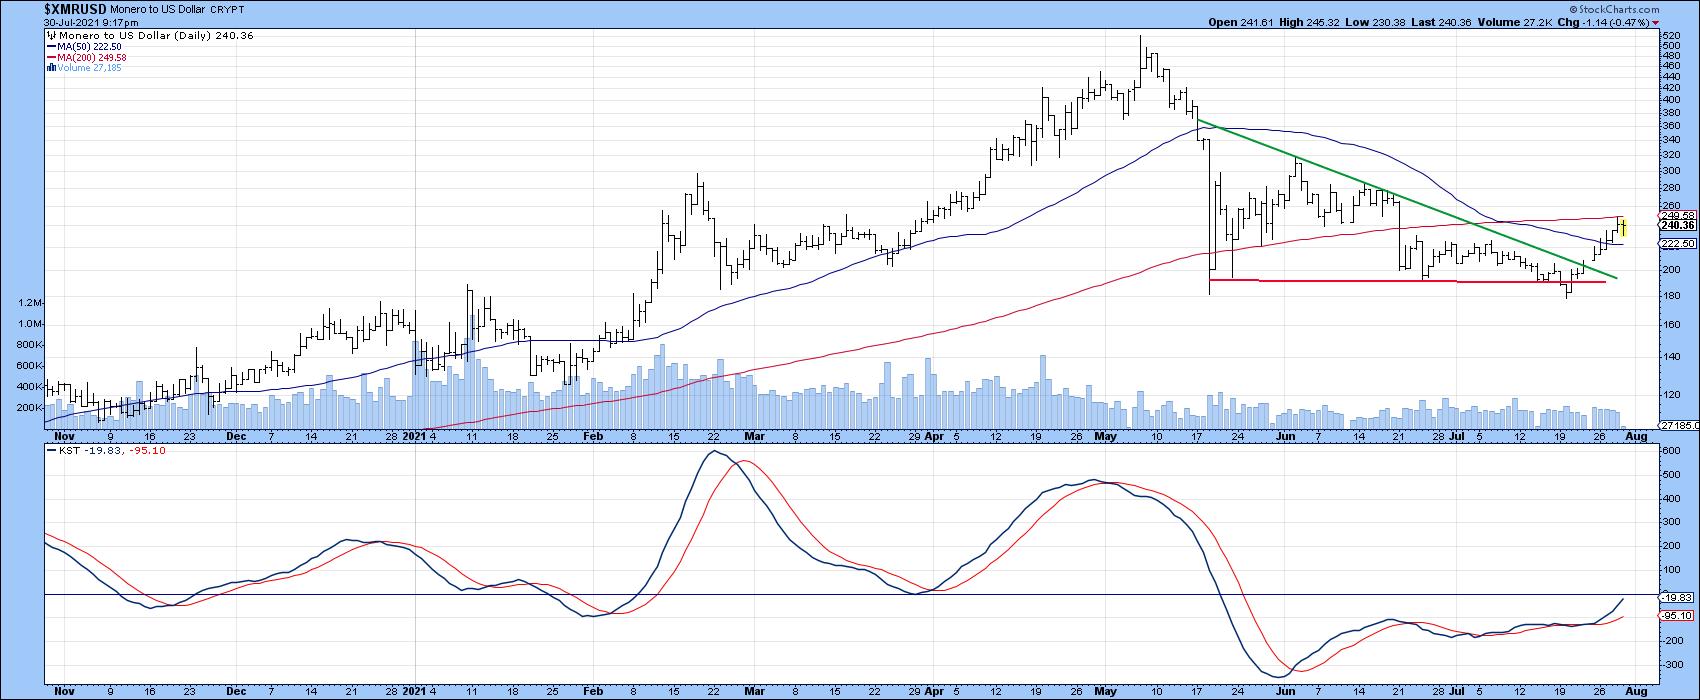 Chart 4
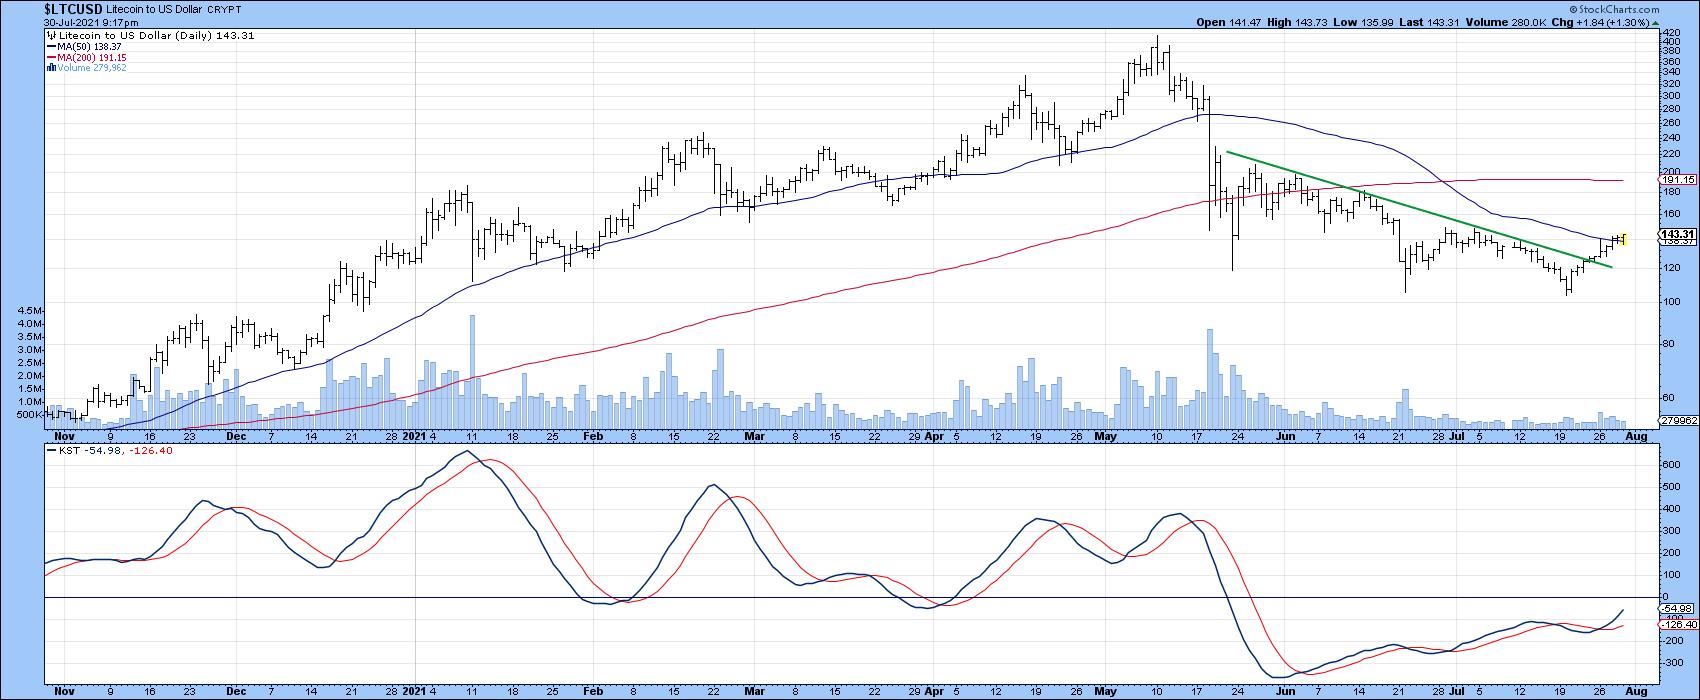 Chart 5
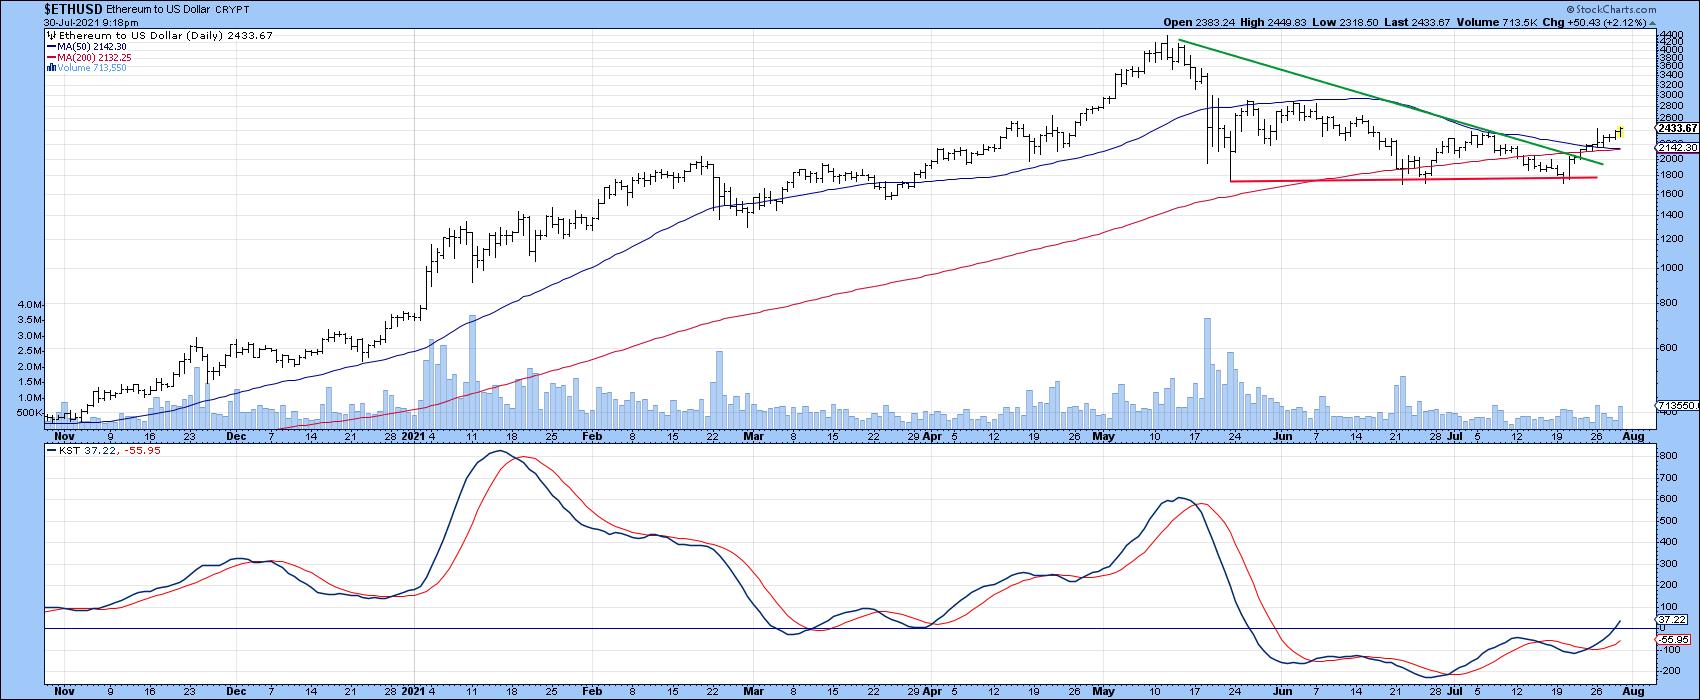 Chart 6Chinese Equities are Starting to Break Down
The cryptos may be heading north to their 200-day MAs, but Chinese equities are moving in the opposite direction. That's because this week's action took the Shanghai Composite back below its 200-day line.
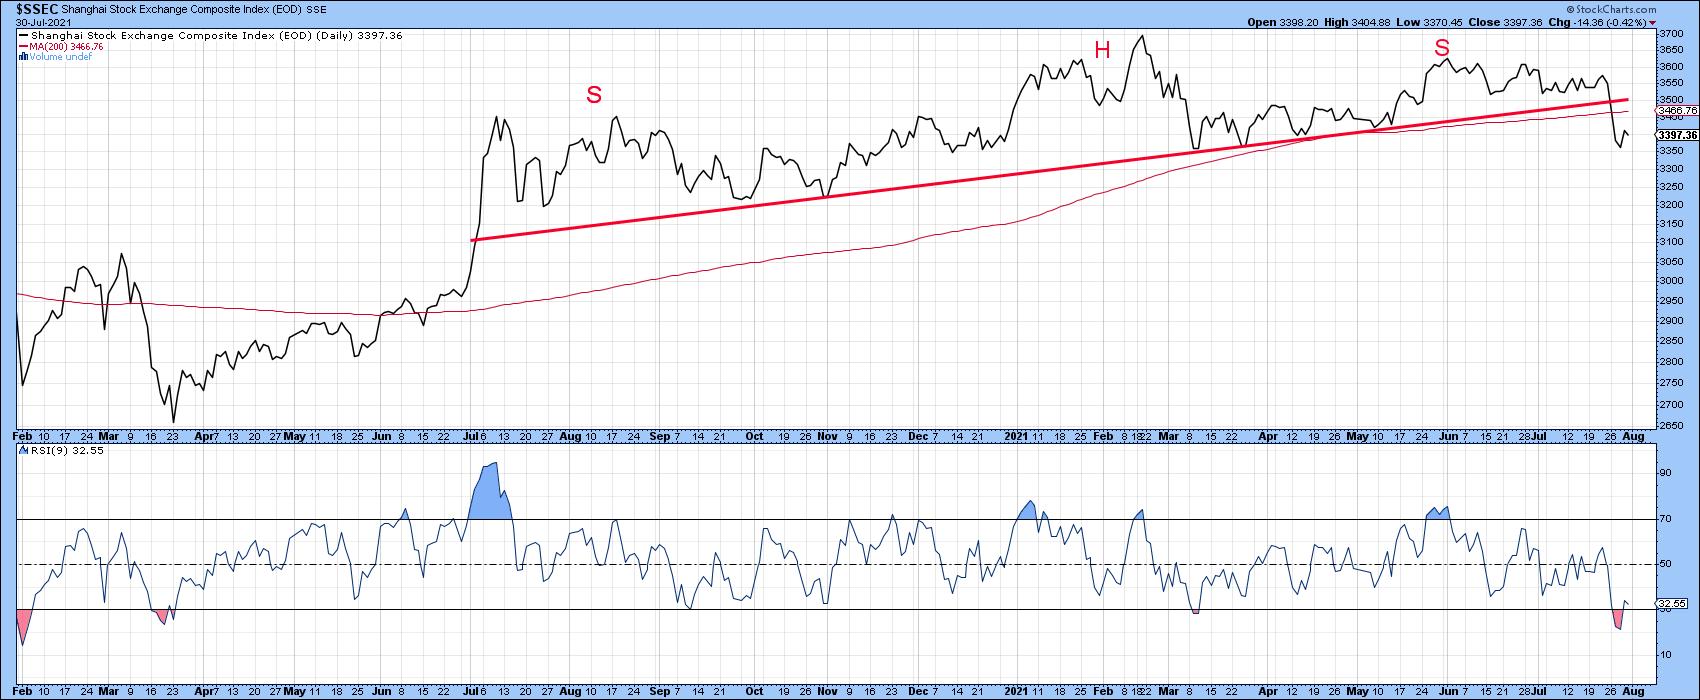 Chart 7
That same move pushed it below the 2020-2021 up trendline, which is effectively the neckline of a bearish upward-sloping head-and-shoulders pattern. If that break holds and the 65-week (Chart 8) EMA does not, such action will likely trigger a long-term KST sell signal. Its short- and intermediate-term counterparts (Chart 8) are already in a marginally bearish mode, so near-term downside pressure looks likely.
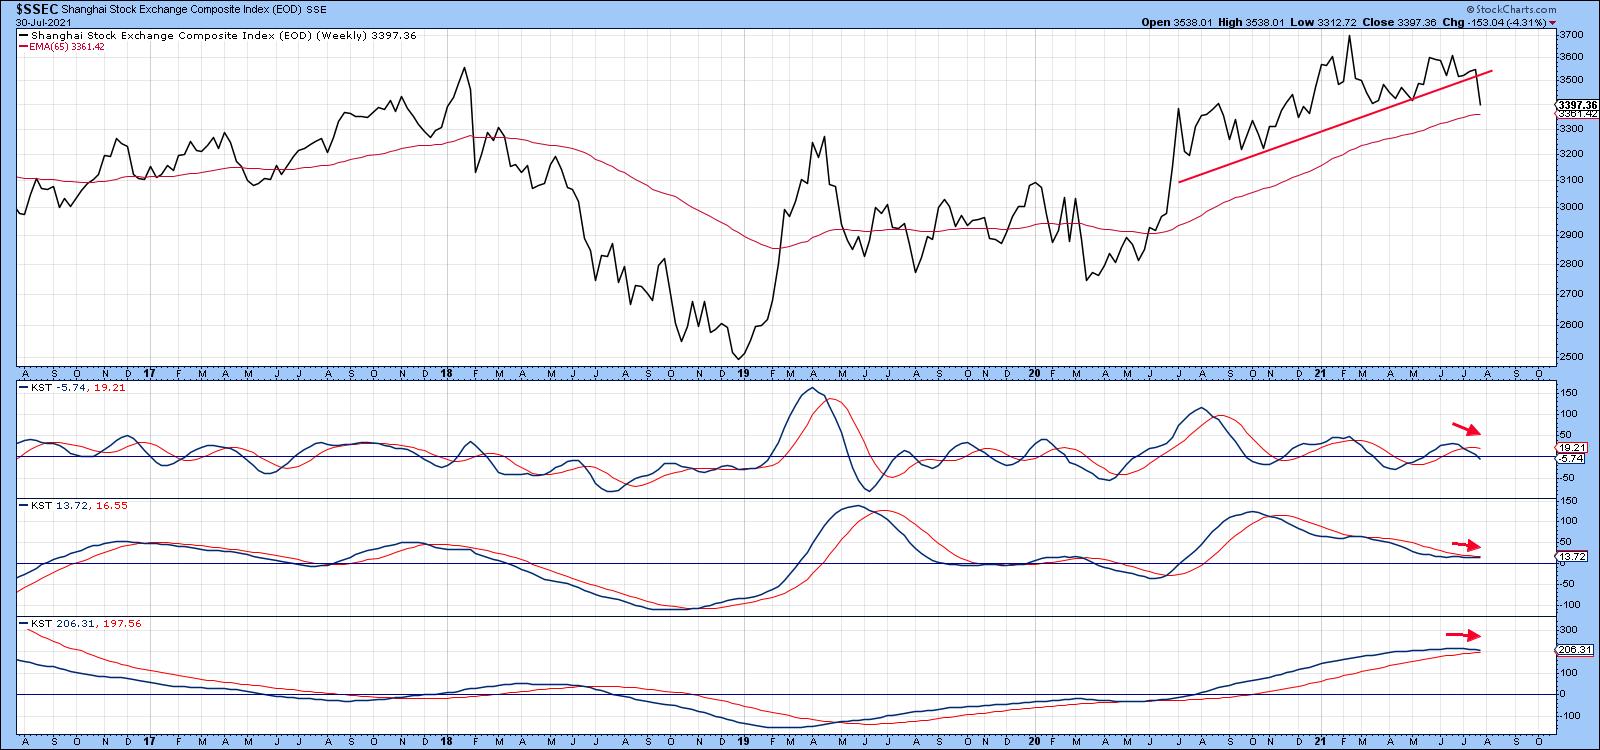 Chart 8The most liquid market average-related Chinese ETF is the iShares MSCI China Fund (MCHI), which is even weaker than the Shanghai Composite. Chart 9 shows that it has completed a 1-year top and dropped decisively below its 65-week EMA. Relative action has been even more questionable, with the violation of a 5-year up trendline and distinct long-term KST sell signal.
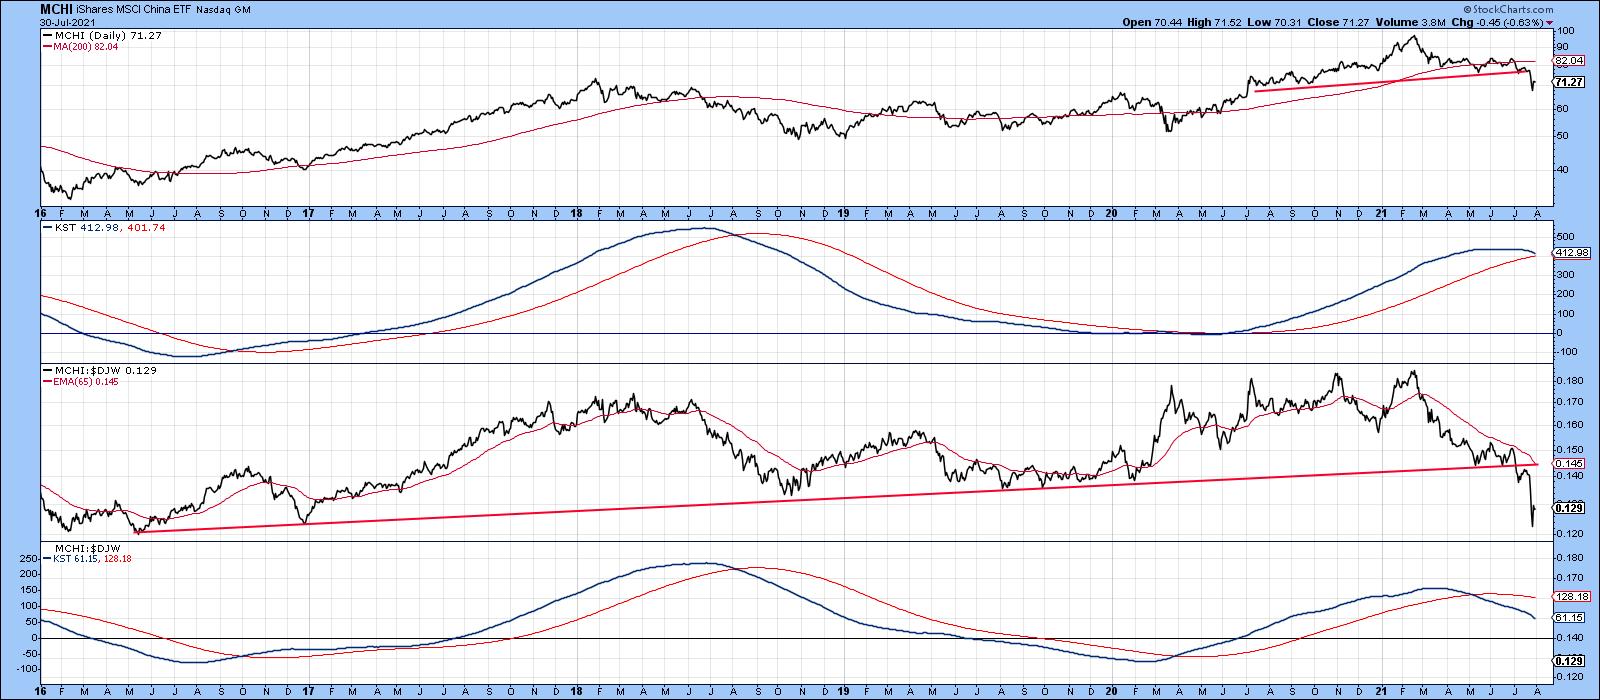 Chart 9Good luck and good charting,
Martin J. Pring
This article is an updated version of an article previously published on Monday, July 26th at 7:22pm ET in the member-exclusive blog Martin Pring's Market Roundup.
The views expressed in this article are those of the author and do not necessarily reflect the position or opinion of Pring Turner Capital Group of Walnut Creek or its affiliates.Chartwatchers update


