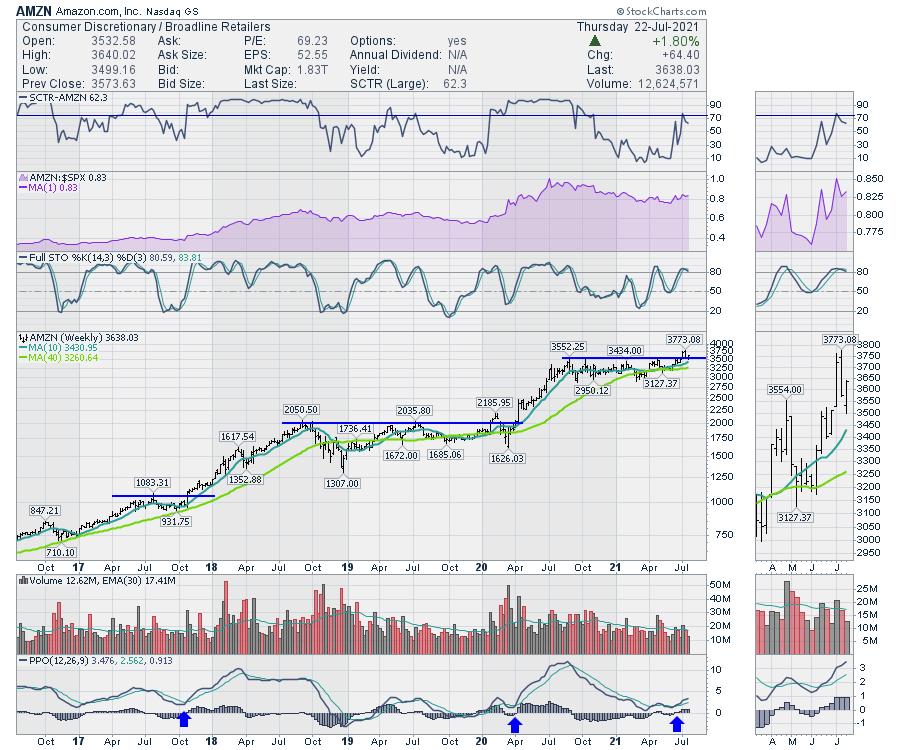
One of the interesting phenomena about investing is how stocks run up, consolidate for a period of time, then mark their next leg of the journey as they break out above the consolidation.
Amazon provides a great example of the pattern, with three large consolidation areas that had a ceiling on them. For swing traders, there are a lot more consolidations areas with breakouts, but the macro view on a weekly chart really works well to see the breakout. People are willing to pay more for the stock than ever before.
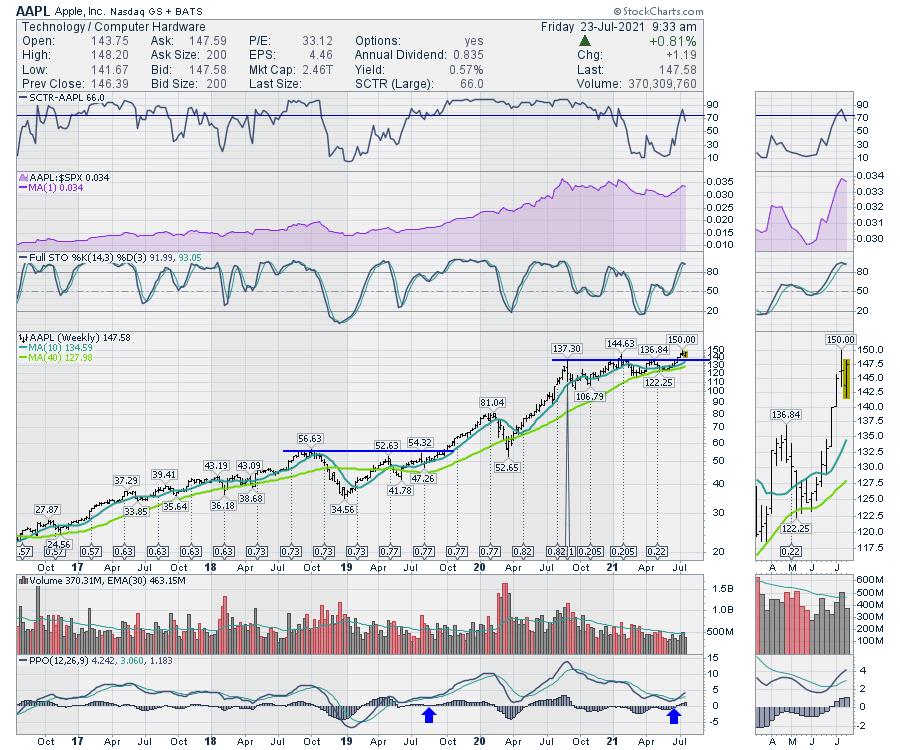
AAPL has done this multiple times.
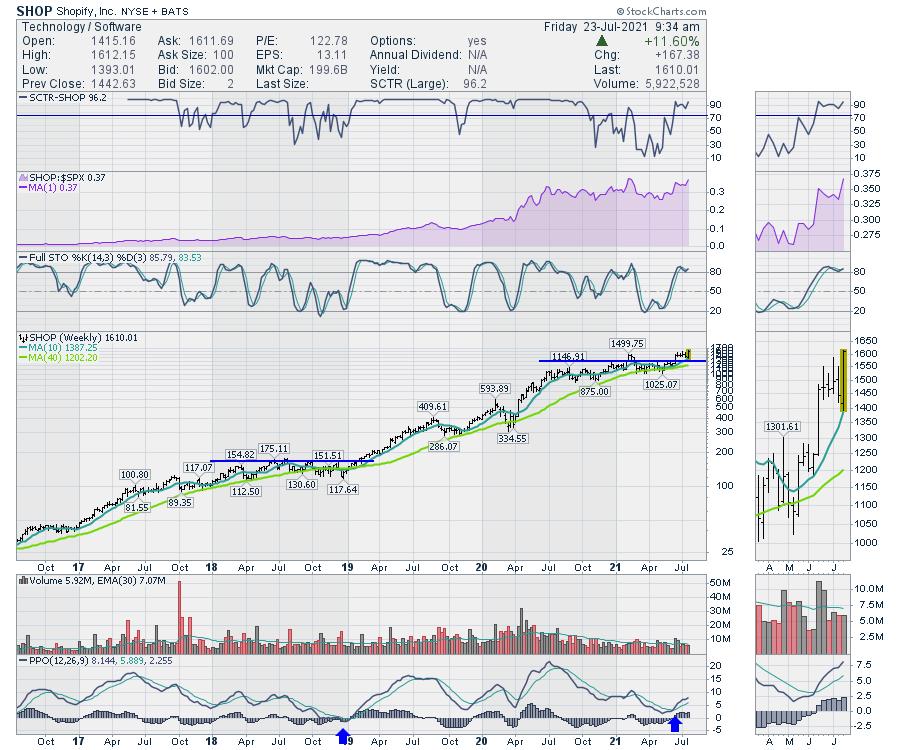
Small companies can exhibit these same traits. The example below is SHOP.
It is the psychology of the trade that is so important. Essentially, the stock runs up and investors start to feel the stock is too expensive for its earnings stream. So they sell it. This creates a pause in the chart or a consolidation. Time goes by and the stock is out of favor. We can see on the SCTR ranking; these stocks are best of breed (above 75) and then they fall out of favor for a period of time.
As their earnings come more into line, investors start to take an interest in the stock. The stock runs up to former highs and "retests" the level and investors interest to pay more for the stock. Eventually, the investors start to take a new perspective on the stock and it goes on another run.
The purpose of technical investing is to watch the investors' behaviour towards a stock. This can be seen in the charts with what we call "price action". The price action is good, weak, consolidating, poor, etc. The price action is the inertia of the core of investors towards the stock.
One of the nicest buy signals for investors is the setup of a stock breaking out to a new high, pausing and then continuing on the run. All three of these stocks are exhibiting signs they are building momentum for their next run.
Good trading,
Greg Schnell, CMT, MFTA
Senior Technical Analyst, StockCharts.com
Author, Stock Charts For Dummies
Want to stay on top of the market's latest intermarket signals?
– Follow @SchnellInvestor on Twitter
– Connect with Greg on LinkedIn
– Subscribe to The Canadian Technician
– Email at info@gregschnell.com


