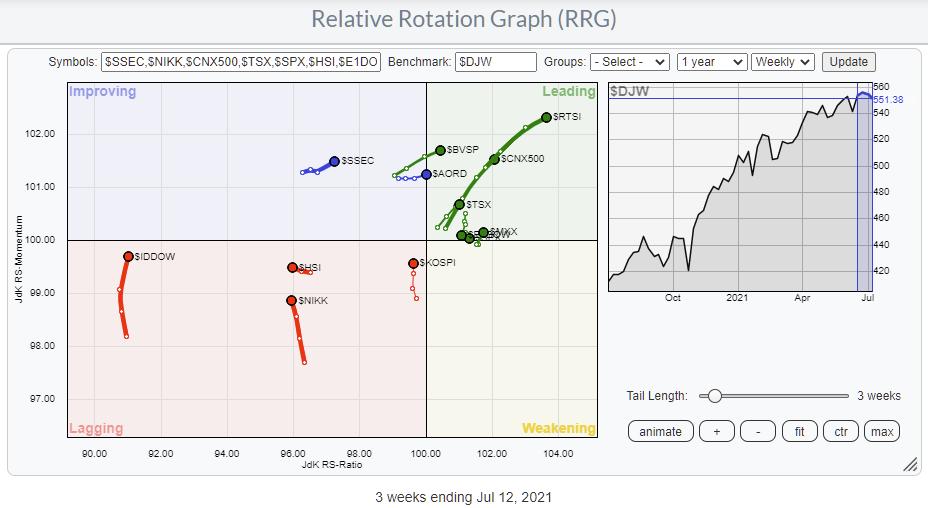
The Relative Rotation Graph above shows the rotation for major stock market indexes against the Dow Jones Global Index.
First of all, this is a so-called "open universe" which means that not all constituents of the benchmark are plotted on the graph. As a result, the universe is not necessarily more or less evenly spread out over the canvas as it usually is with a closed universe.
The more interesting rotations in this universe are found inside the leading quadrant.
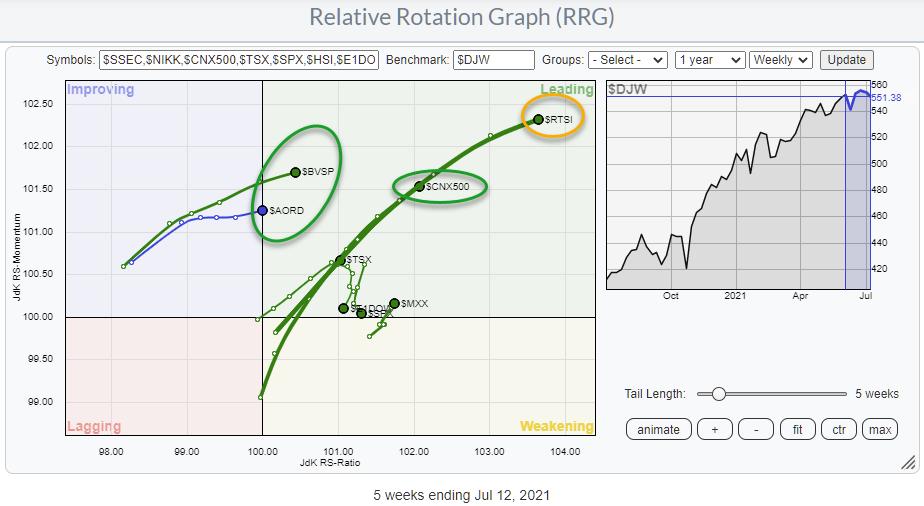
The tail furthest into the leading quadrant is for $RTSI (Russia Trading System Index). On the same trajectory, but not as far in, is the Indian $CNX500, while even lower on that trajectory we find the Canadian $TSX. Brazil ($BVSP) and Australia ($AORD) are entering the leading quadrant this week at good momentum values.
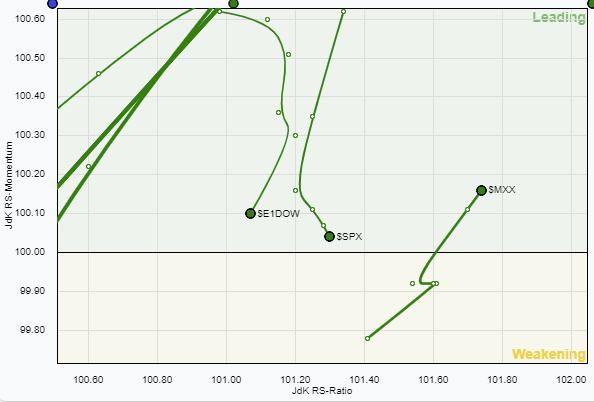 In the cluster close to 100 on the JdK RS-Momentum line inside the orange oval, we have the US ($SPX), Europe ($E1DOW) and Mexico ($MXX). The small RRG magnifies this area. Mexico just returned to the leading quadrant after a rotation through weakening, but both $SPX and $E1DOW are heading South. The $SPX picked up a bit of relative strength last week while $E1DOW continued to lose on both scales.
Inside this universe and inside the leading quadrant in this RRG, both tails are weakening, signaling that other markets are picking up steam vs Europe and the US. Bringing the tails from the leading quadrant on the weekly RRG to a daily RRG gives the picture below.
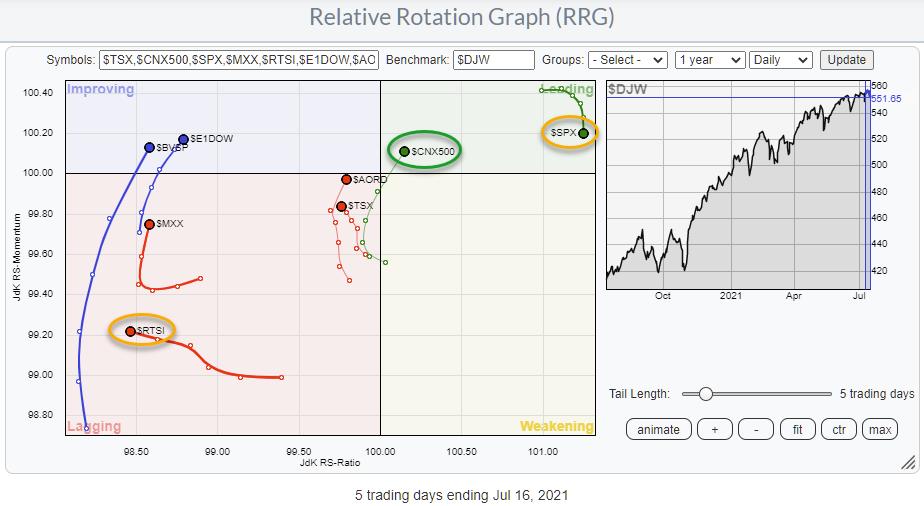
The position of the $RTSI tail inside lagging and pushing lower on the JdK RS-Ratio scale suggests that the weekly tail is about to roll over. That is to say, the period of relative outperformance for Russia is coming to an end.
On the daily RRG above, the $SPX is rolling over inside the leading quadrant and getting back to the same RRG-Heading as the weekly tail for $SPX. This suggests that more underperformance vs. the world in underway in coming weeks.
Europe and Brazil are moving into the improving quadrant on the daily RRG. The long daily tail for Brazil supports a further push into the leading quadrant on the weekly RRG. The weekly tail for Europe moving opposite to the daily makes it difficult to get a clear handle. However, the shorter tail for Europe on the daily RRG and the weekly tail at a negative RRG-Heading tips the balance more to weakness/underperformance, IMHO.
Closer to the benchmark are the Australian $AORD and the Canadian $TSX. The $AORD picked up nicely the last day of the week and is now back at a positive heading in line with the weekly tail, suggesting that more strength lies ahead. $TSX needs to pick up relative strength, move higher on the RS-Ratio scale to get back in line with the weekly tail for Canada.
The most promising index in this universe for the moment seems to be the India Nifty 500. Well inside the leading quadrant and moving at a strong RRG-Heading on the weekly RRG, it is just returning into the leading quadrant at a strong heading on the daily RRG.
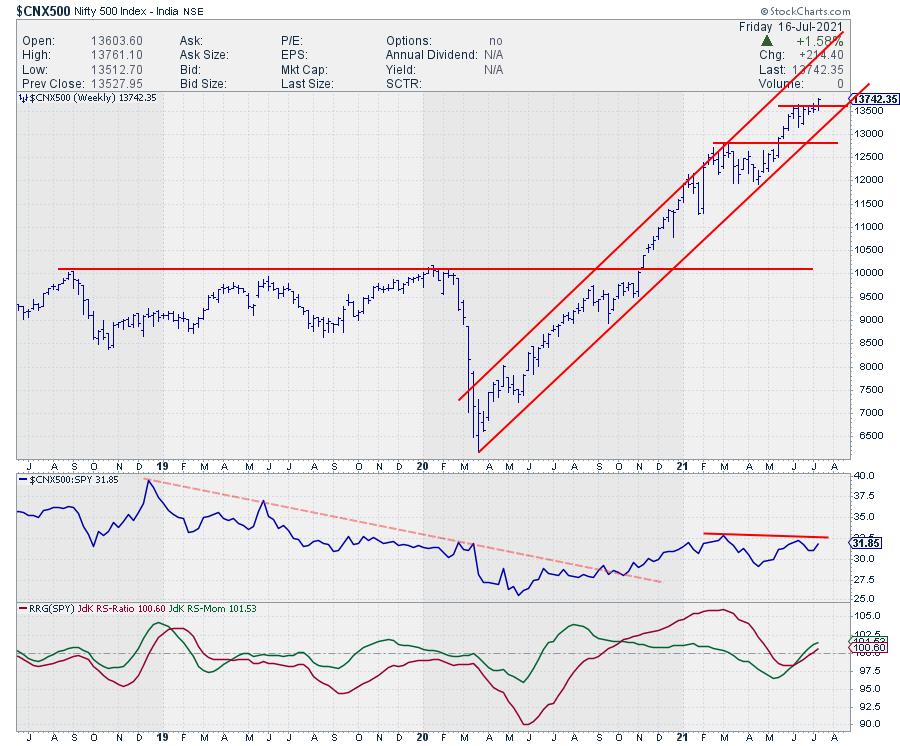
This week's upward break on the weekly price chart will very likely cause an acceleration in the ongoing uptrend. With the bigger components of the global index (Europe and US) under pressure, India seems to be a very reasonable alternative for some alternative equity exposure.
Some of the ETFs that you could use and which are available to chart on StockCharts.com are FLIN, PIN, and INDA.
#StaySafe and have a great weekend, --Julius
My regular blog is the RRG Charts blog. If you would like to receive a notification when a new article is published there, "Subscribe" with your email address.
Julius de Kempenaer
Senior Technical Analyst, StockCharts.com
Creator, Relative Rotation Graphs
Founder, RRG Research
Host of: Sector Spotlight
Please find my handles for social media channels under the Bio below.
Feedback, comments or questions are welcome at Juliusdk@stockcharts.com. I cannot promise to respond to each and every message, but I will certainly read them and, where reasonably possible, use the feedback and comments or answer questions.
To discuss RRG with me on S.C.A.N., tag me using the handle Julius_RRG.
RRG, Relative Rotation Graphs, JdK RS-Ratio, and JdK RS-Momentum are registered trademarks of RRG Research.