When reviewing my charts last weekend, several jumped out as being at a pretty critical juncture, and therefore worthy of monitoring going forward. A couple of them involved the stock market, so I'll start there.
Two Stock Market Relationships
I have always been fascinated by the relationship between stocks and gold, as these are two completely different asset classes. Stocks offer the potential for growth and a dividend return, though we have not seen much of the latter in the last few years. Gold, on the other hand, is a store of value and historical hedge against instability, especially of the inflationary variety.
Chart 1 shows that this relationship has completed three major swings since 1970; a fourth, favoring stocks, is now underway. That trend began in 2011, but is now running into resistance in the form of the neckline of a potential inverse head-and-shoulders pattern. The ratio is currently above its rising 12-month MA and the long-term KST is also bullish, so an upside breakout is a likely possibility. That resistance line goes all the way back to 2003 and has been touched or approached on numerous occasions. It therefore represents a significant barrier, which, if breached, will signal a multi-year advance favoring equities.
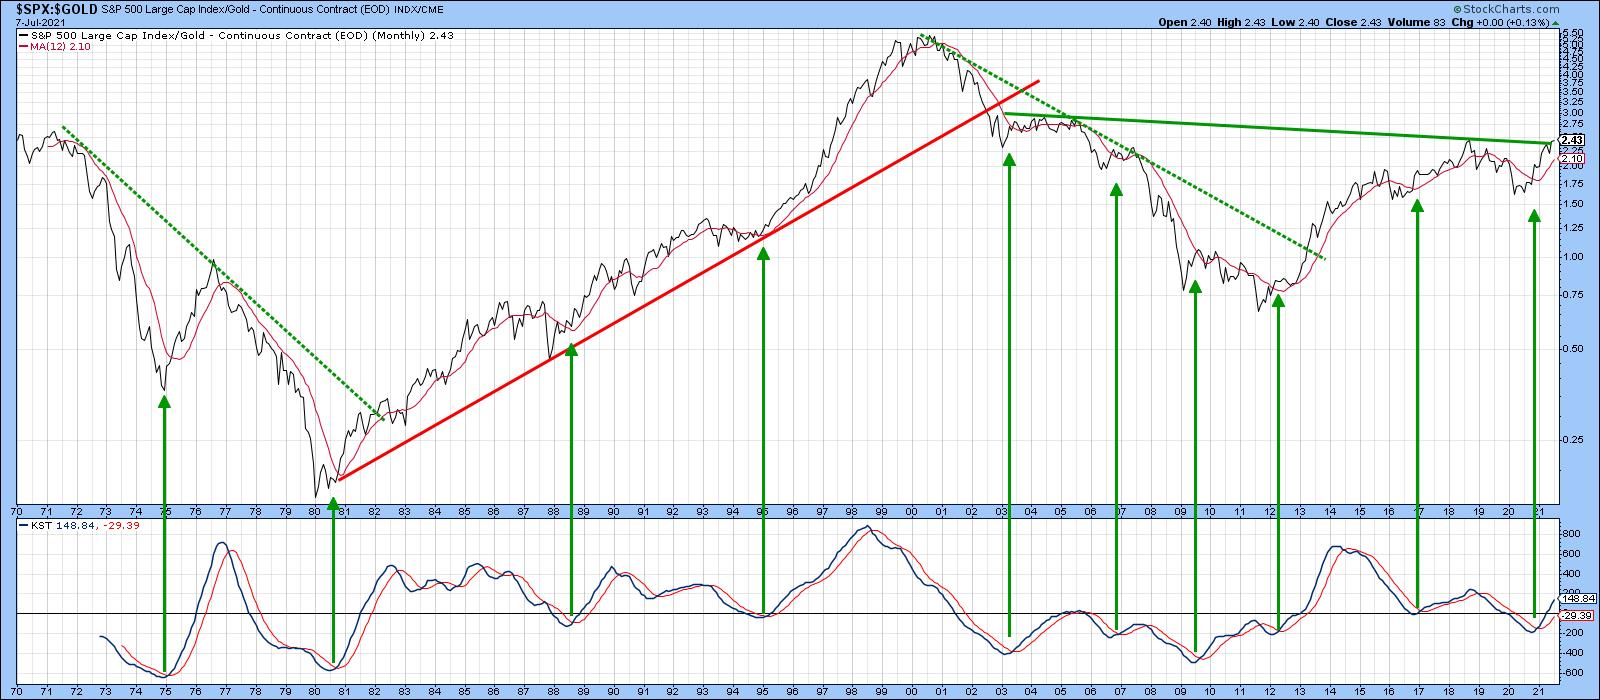 Chart 1
Using the benefit of hindsight, the green shading in Chart 2 flags periods when stocks have outperformed gold for an extended period. If you look at the upper window featuring the S&P, you will see that stocks typically rise, which means that a breakout will not only be bullish for stocks relative to gold but favor stocks in their own right. That observation does not rule out corrections along the way, but speaks to the main trend.
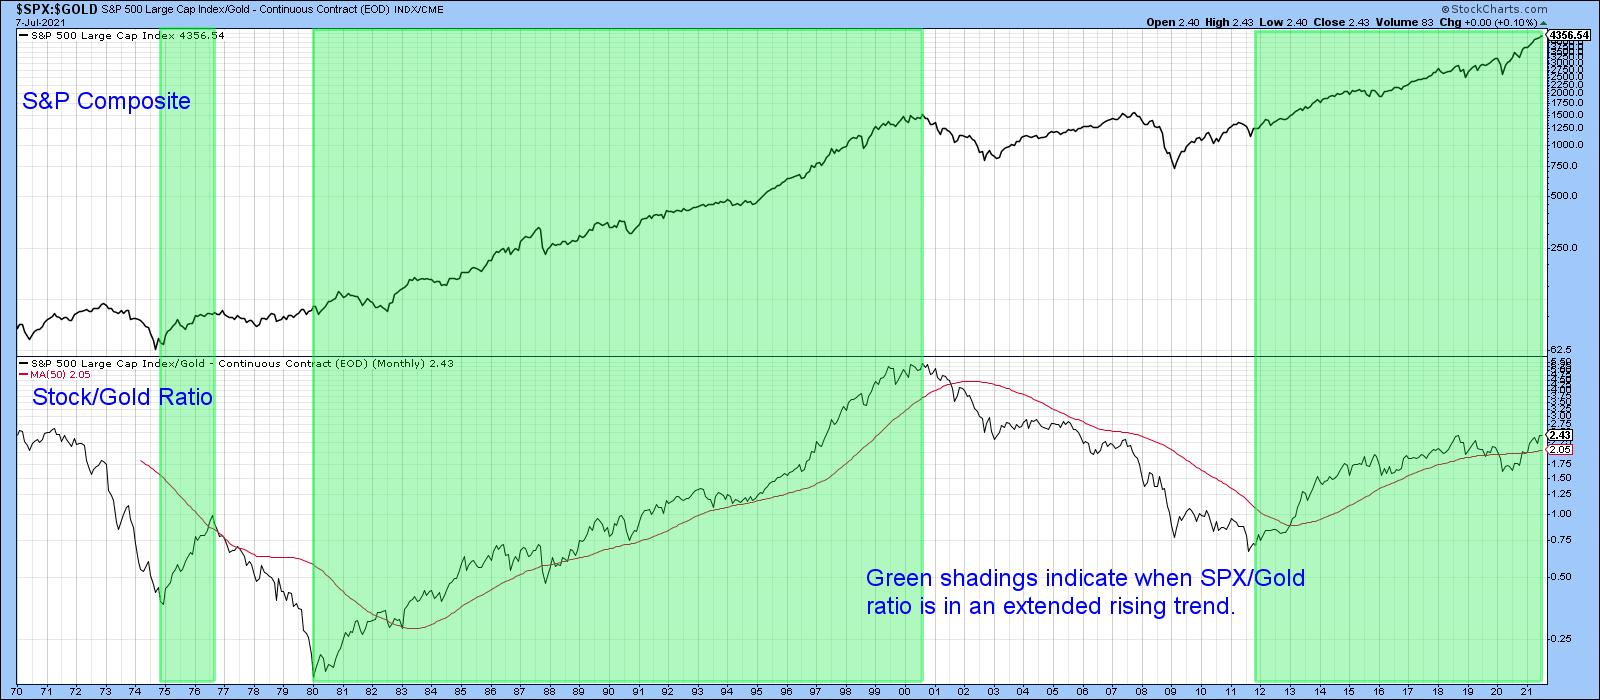 Chart 2
Another intermarket relationship that looks promising for stocks is the ratio between the S&P Composite and the SPDR Consumer Staples (XLP). Generally speaking, staples are an area of the market that investors turn to when they are cautious. That's because these companies tend to pay generous dividends. In addition, since their earnings are more stable, they are easier to predict. Consequently, when the S&P is outperforming staples, it reflects the fact that investors are growing in confidence, so the market tends to rise. When staples are outperforming, investors are in a defensive mood. That's not always bearish for the market, but, by the same token, if trouble is going to arise, that is the time when it usually does.
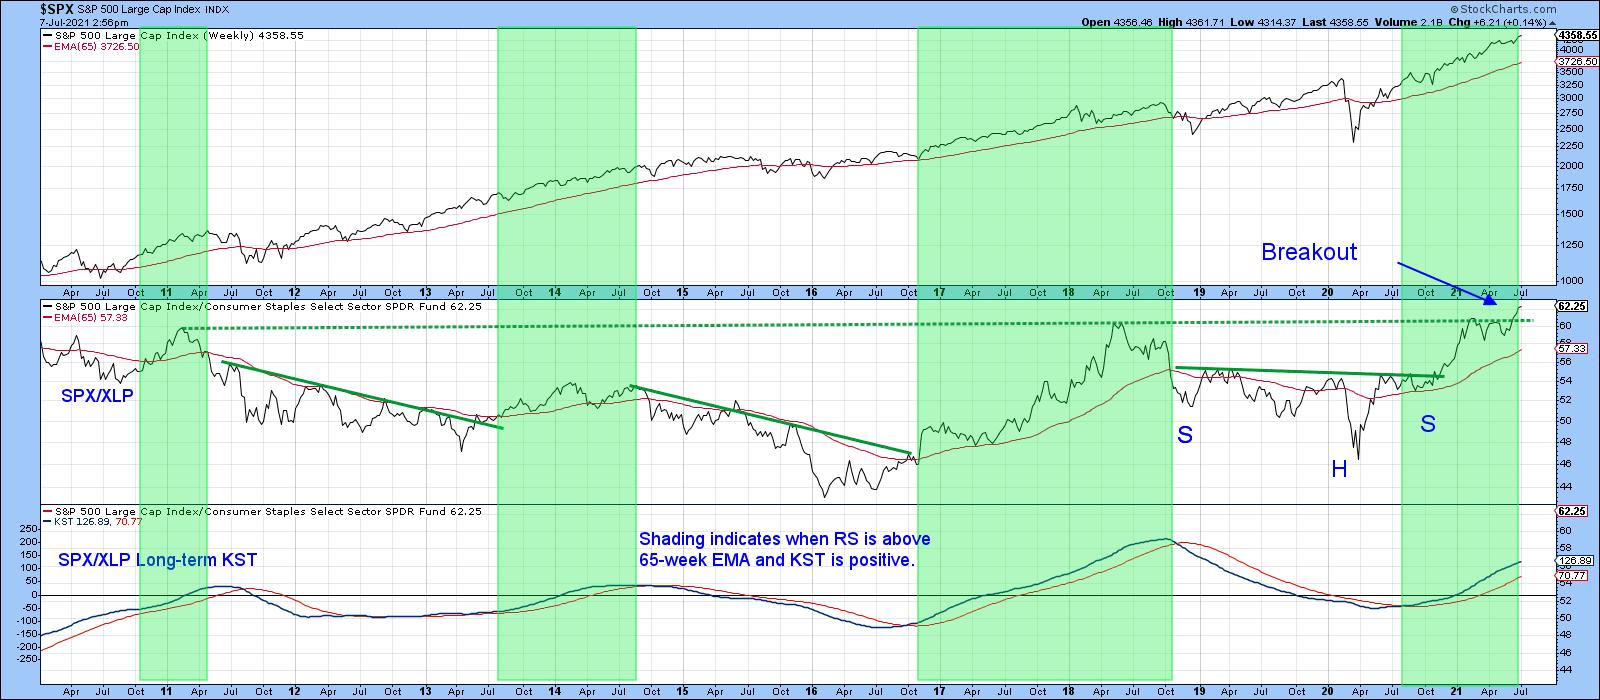 Chart 3
The green shadings in Chart 3 tell us when the ratio is above its 65-week EMA and the long-term KST is trading above its 26-week EMA. You can see from looking at these areas that this is usually bullish for the SPX. The chart also demonstrates that the ratio has broken above a significant down trendline on three occasions in the last 12 years. All were followed by a period of S&P strength. In the last couple of weeks, this relationship has cleared a 10-year trading range, suggesting that a major extension to the 2020 advance is likely.
Chart 4 supports the idea that this is a valid breakout, as the short-term KST has just gone bullish and is by no means overextended.
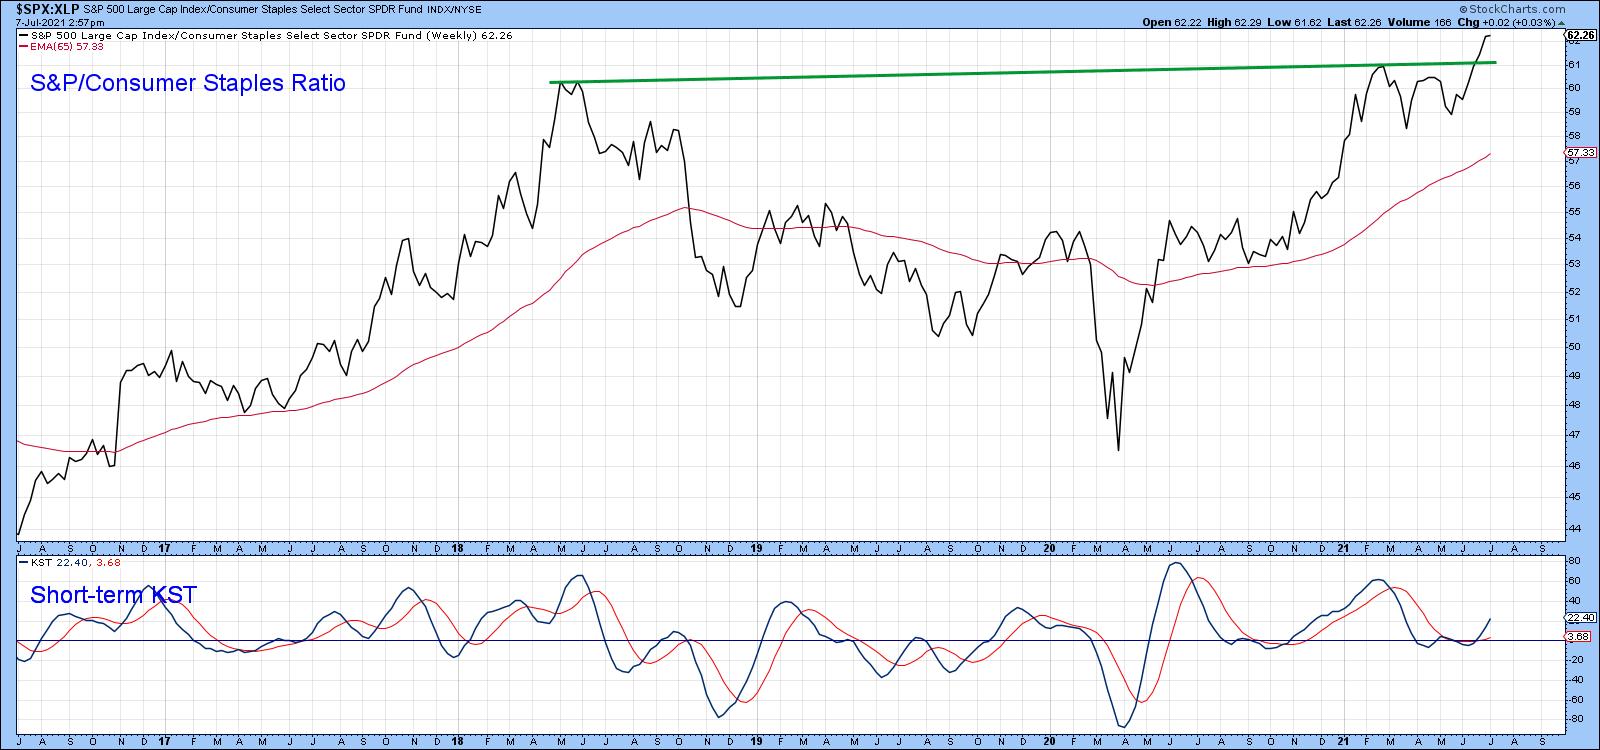 Chart 4
S&P vs the World
Since the financial crisis, the S&P Composite has been in a secular uptrend relative to the MSCI World ETF (ACWI). The ratio has been in a holding pattern since 2020, but, once again, appears to be emerging on the upside. This can be appreciated from from Chart 5, which tells us that it is currently breaking out from a reverse head-and-shoulders consolidation formation. This action is also being supported by the Special K (SPK), which you can read about here. Generally speaking, when a trendline of 9 months or greater duration is violated, that signals an important reversal in this indicator and the price series it is monitoring. A violation of the red signal line acts as supporting evidence. Such a joint break took place on the downside in the middle of last year, a development which was followed by an extended sideways correction.
In the last couple of days, the Special K has managed to edge above its 2020-21 down trend and signal lines once again. Since the short-term KST (in the bottom window) is in a positive mode, it seems likely that these breakouts will become more decisive.
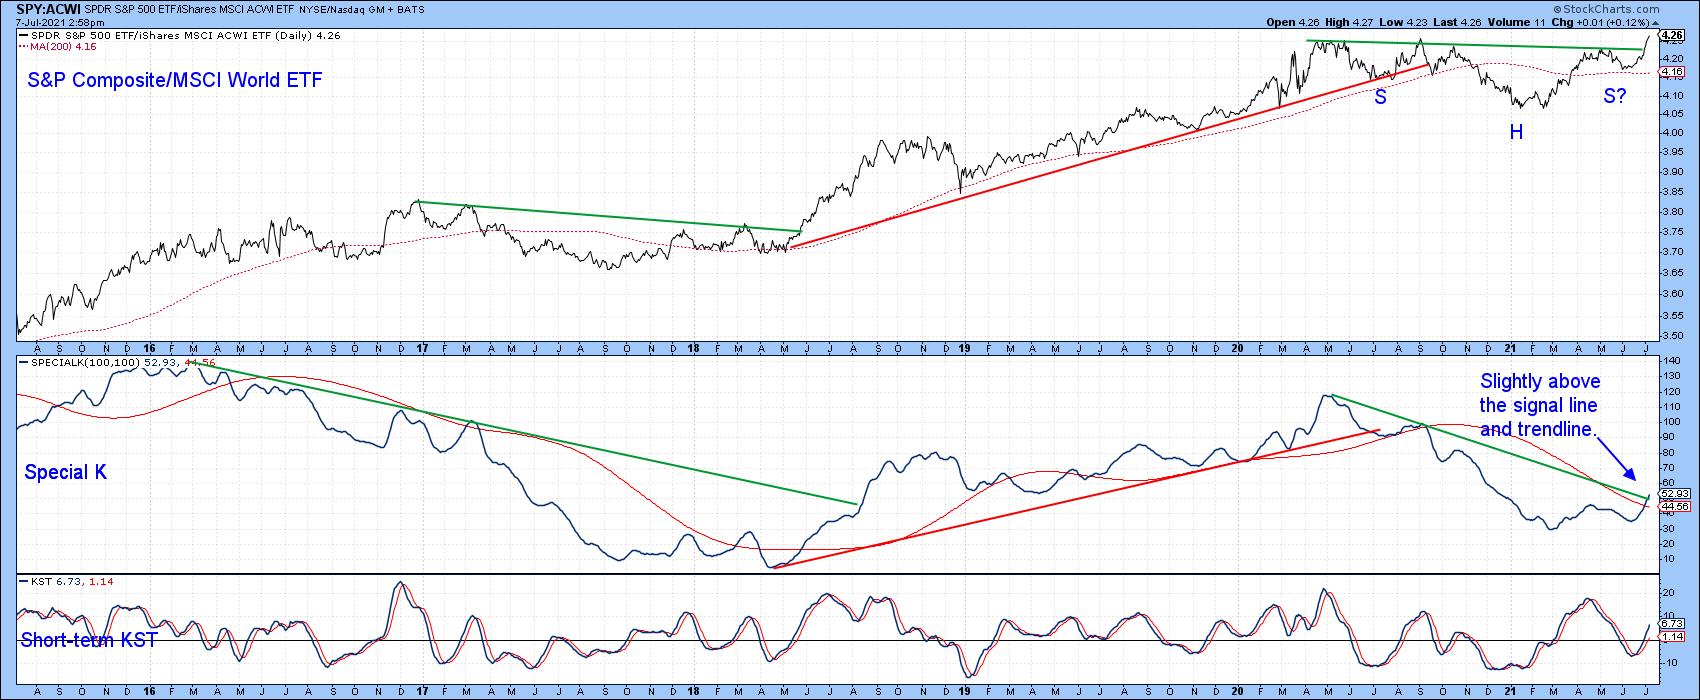 Chart 5
The SPY/ACWI breakout is not occurring in isolation. In that respect, Chart 6 reveals that two other relationships are also favoring the US. The middle panel shows that the S&P is breaking out against the MSCI Europe Australia Far East ETF (EFA). The unweighted S&P (RSP) has seen an even stronger breakout.
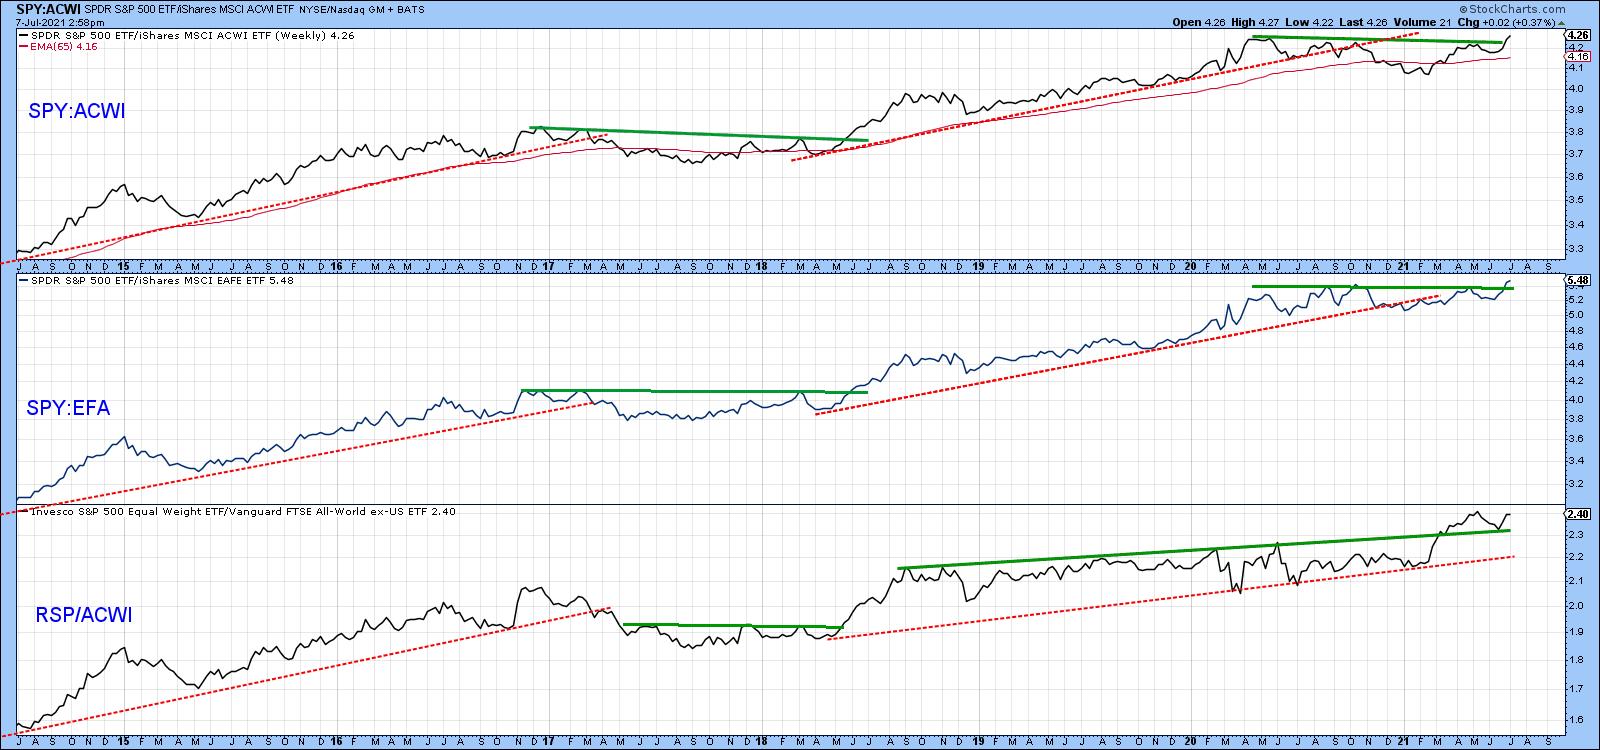 Chart 6
Quite a lot of the time, superior performance by the US relative to the rest of the world involves capital flows that have the effect of boosting the US Dollar Index. That's what appears to be happening now, as the Index looks as though it may be in the final phase of completing a reverse head-and-shoulders pattern. That breakout is likely to materialize because my diffusion indicator monitoring a universe of cross-dollar relationships in a positive trend, and is in a bullish but not overextended mode.
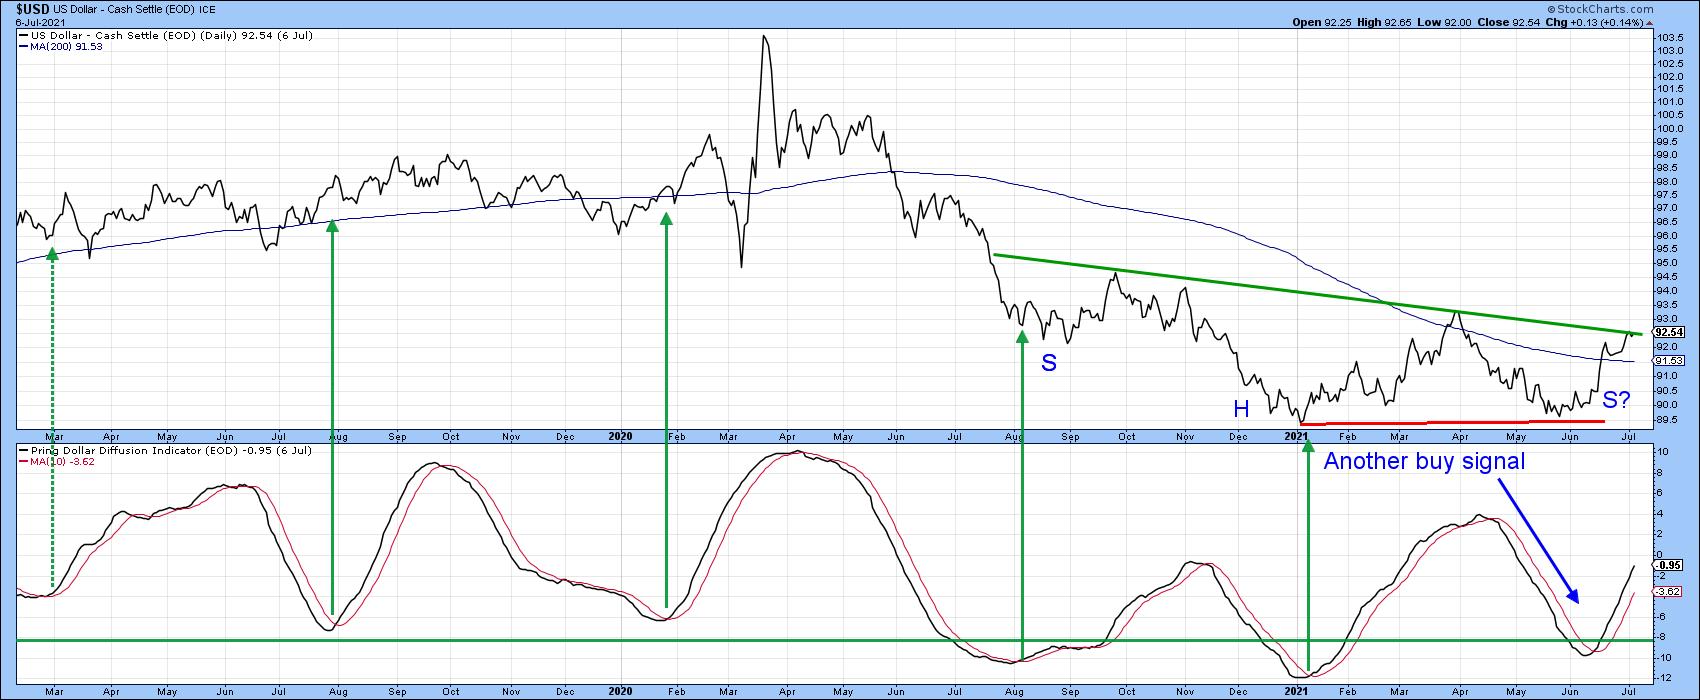 Chart 7
Good luck and good charting,
Martin J. Pring
This article was previously published on Wednesday, July 7th at 8:18pm ET in the member-exclusive blog Martin Pring's Market Roundup.
The views expressed in this article are those of the author and do not necessarily reflect the position or opinion of Pring Turner Capital Group of Walnut Creek or its affiliates.


