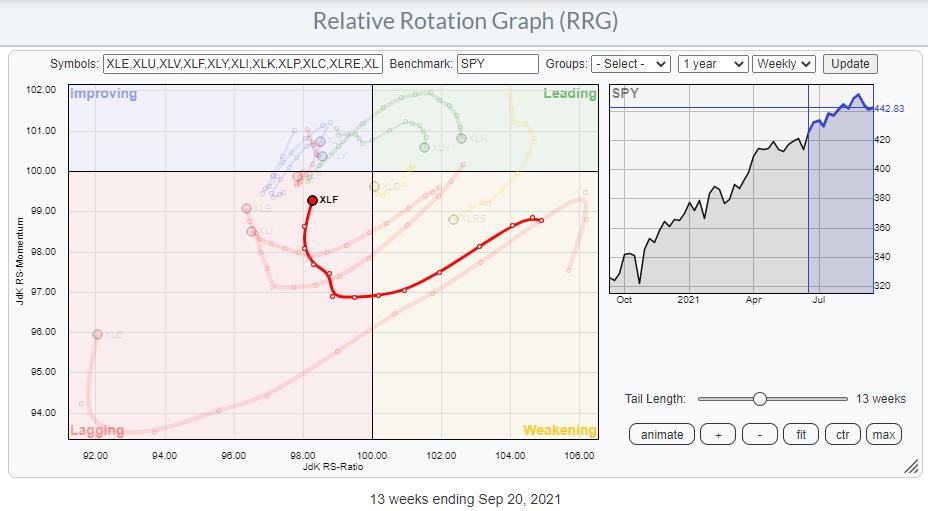
On the Relative Rotation Graph for sectors, the Financials sector, XLF, is positioned inside the lagging quadrant and heading upwards to the improving quadrant. The sector is gaining on the vertical JdK RS-Momentum axis, but not so much (yet) on the horizontal Jdk RS-Ratio axis.

On the price chart, XLF left its rising channel a few weeks ago and, this week, dipped to a low near 36 before jumping back sharply. That recent price action has created the possibility for a double-top formation in the making. Both highs (tops) are located near 38.50 and the in-between low is near 35. That pattern will be completed on a break below that 35 support level.
Looking at the 9-period RSI plotted above the graph, a strong negative divergence can be noted. The second high is located marginally higher than the previous high (see solid red arrow), while the corresponding sequential high in the RSI is significantly lower than the first one, creating a divergence. This is usually a sign for a pause in, or a reversal of, the existing trend.
In case of such a breakdown, the next support level, and expected price target, in that case, is located at the previous breakout level near 31.50. The good news for this sector is coming from a relative perspective. The raw RS-Line (first panel below the price chart) is managing to hold up above its breakout level since mid-February this year. After a sideways move and a re-test of the relative breakout level as support, the decline in the RRG-Lines (lower panel) has now come to a rest and both lines have started to curl upward, causing the current position on the RRG.
In order for a further upward rotation into improving and then into leading, the raw RS-Line needs to break above that falling resistance line, dashed light red, which is connecting the major relative highs since 2016. The downtrend in relative strength goes back even further. A positive impulse for the financials sector as a whole would be triggered when XLF can leave the consolidation area to the upside. Such a move would likely mean the resumption of the previous uptrend, but at a slower pace.
The Groups inside Financials

From the Sector Summary page, we can run a Relative Rotation Graph of the groups that make up the Financials sector. A few of these groups are showing interesting rotations.
Inside the leading quadrant, my attention is drawn to the two green tails that are moving up into the leading quadrant at a strong RRG-Heading; the US Insurance Brokers Index and the US Full Line Insurance index. The US Consumer Finance Index, the US Financial Administration Index, and to a lesser extent the US Reinsurance Index are showing powerful tails inside the lagging quadrant and pointing further into it. The RRG below highlights these tails.

From this chart, we can quickly exclude the three red tails for potential buying opportunities.
DJ US Reinsurance Index

Out of these three, the Reinsurance Index looks to be showing the weakest chart, especially from a relative perspective.
The raw RS-Line has just broken to new lows and has started pulling the RRG-Lines lower again. As the red JdK RS-Ratio line did not manage to move above 100 before turning down again, that means this group rotated from lagging into improving, then back into lagging. Which, as we know, signals the second (or 3rd, etc.) leg of an already-established relative downtrend.
Insurance Brokers

The Insurance Brokers group is deepest inside the leading quadrant. On the price chart, the rising channel is still fully intact, and the group even has some room to decline without leaving that channel. On the relative chart, the bottoming process is nicely visualized; this has led to an improvement for the RRG-Lines, which are now both above 100 and continuing to move higher. This makes insurance brokers the strongest group within the financials sector at the moment.
Full Line Insurance

The Full Line Insurance group is not as far in as Insurance Brokers. On the price chart, the group is pushing against a heavy overhead resistance level between 53-55, while relative strength is also pushing against the upper boundary of a range in which it has been moving since early 2020. An upward break in either of these graphs will very likely cause further improvement and push the group further into the leading quadrant.
Conclusion
All in all, both Insurance Brokers and Full Line insurance seem to be groups in which we can look for stocks to buy. Potential short positions to hedge the market risk for this sector, if you wish to do so, could be found in Consumer Finance, Financial Administration and/or Reinsurance.
#StaySafe and Have a great weekend, --Julius
My regular blog is the RRG Charts blog. If you would like to receive a notification when a new article is published there, "Subscribe" with your email address.
Julius de Kempenaer
Senior Technical Analyst, StockCharts.com
Creator, Relative Rotation Graphs
Founder, RRG Research
Host of: Sector Spotlight
Please find my handles for social media channels under the Bio below.
Feedback, comments or questions are welcome at Juliusdk@stockcharts.com. I cannot promise to respond to each and every message, but I will certainly read them and, where reasonably possible, use the feedback and comments or answer questions.
To discuss RRG with me on S.C.A.N., tag me using the handle Julius_RRG.
RRG, Relative Rotation Graphs, JdK RS-Ratio, and JdK RS-Momentum are registered trademarks of RRG Research.


