As you probably know, my background is in public accounting. I practiced as a CPA for two decades prior to turning my full attention to technical analysis. My analysis of the stock market always includes both fundamental and technical analysis, with a historical component sprinkled in. (I never met a spreadsheet I didn't like!) So when I look at the stock market, I don't view it as just whether it's going up or down; I need to look under the hood and really investigate what's making it tick. Is the rally sustainable? Could we be topping? What's leading? What should be leading? I'm always very inquisitive and try to look deeper.
And it's that inquisitiveness that leads me to this ChartWatchers article. Wall Street is turning their attention back to consumer discretionary stocks, so we should too.
Secular Bull Market Leading Sectors
One thing that's crystal clear to me is that we're in a secular bull market that began on April 10, 2013, the day that the S&P 500 cleared its double top from 2000 and 2007. Since that day and through Thursday's close, here are the returns of all 11 sectors (I've included the S&P 500 as the benchmark):
- Technology (XLK): +483.24%
- Communication Services (XLC): +321.11%
- Consumer Discretionary (XLY): +283.21%
- Health Care (XLV): +221.26%
- Financials (XLF): +197.96%
- Industrials (XLI): +183.41%
- S&P 500 ($SPX): +180.21%
- Materials (XLB): +146.63%
- Real Estate (XLRE): +143.40%
- Consumer Staples (XLP): +119.09%
- Utilities (XLU): +117.66%
- Energy (XLE): -12.29%
After looking at the above stats, one other thing is crystal clear to me: aggressive sectors lead by a very wide margin during secular bull markets. Laggards since 2013 include materials and energy, two sectors adversely impacted by a rising dollar environment, and three defensive sectors. The big leaders are what I consider the 3 most aggressive sectors -- technology, communication services and consumer discretionary.
When the market goes through a period of turmoil, I like to analyze which areas outperform and underperform, as heavy selling provides Wall Street an opportunity to rotate into areas believed to be the next winners. I generally like aggressive areas that outperform during periods of market weakness.
This leads me to consumer discretionary, as the XLY is one of two sectors that have gained ground since the S&P 500 topped on September 2nd. While the S&P 500 has dropped nearly 2%, the XLY has gained 0.46%. Money is rotating into the group, but it's difficult to see unless you perform an analysis.
Here's a 1-year chart of XLY absolute and relative strength:
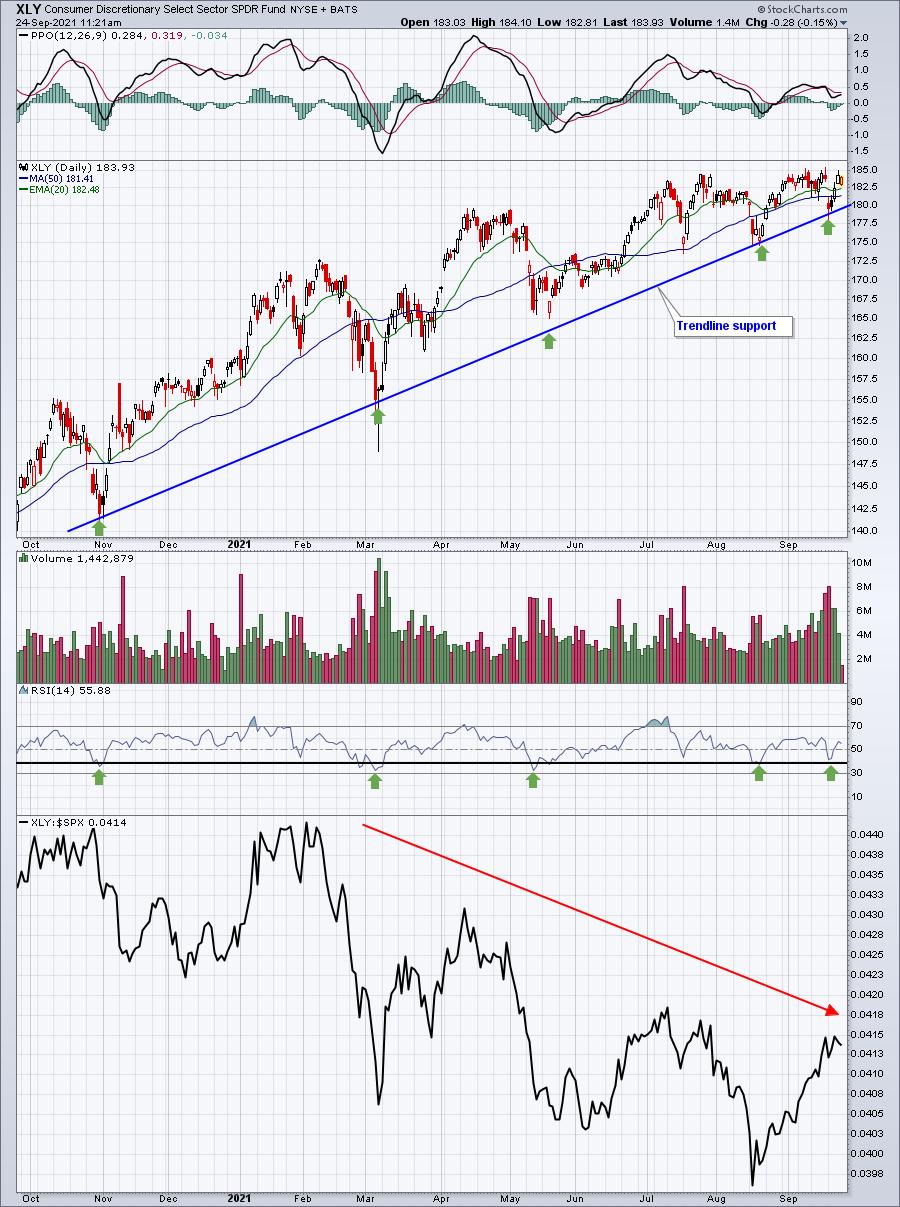
The absolute price uptrend remains in play. Every time the RSI has approached 40, or dipped just beneath it, we've seen a rebound. Those RSI lows have also coincided with connecting points on the trendline (green arrows). So I don't believe there's any denying that an uptrend remains in play. The relative strength, however, is a bit more difficult to figure out. We're still in a pattern of lower relative highs and lower relative lows, which suggests the group still has work to do. But when I stretched out the XLY onto a 10-year weekly chart, the potential breakout in relative strength looked much more bullish to me:
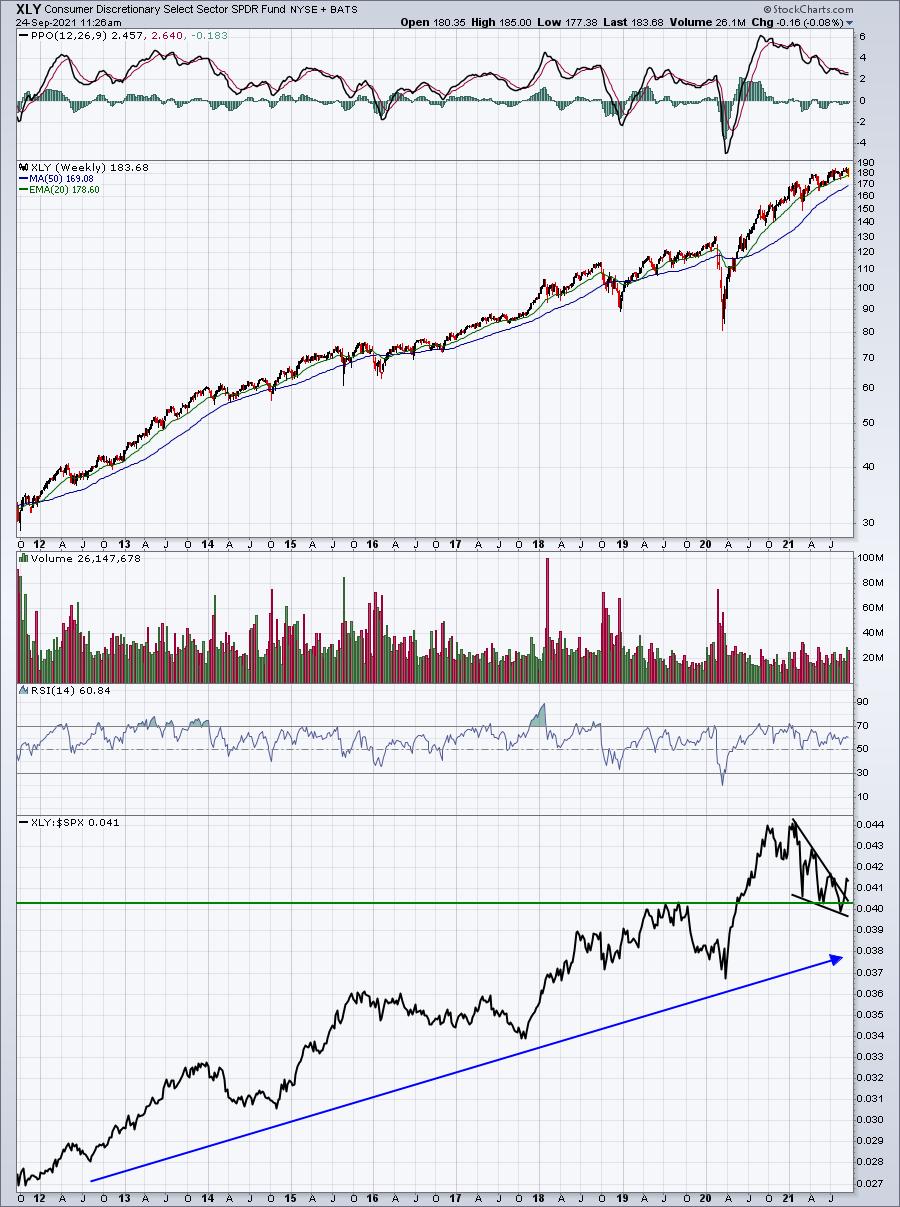
The relative uptrend long-term remains perfectly intact and the recent relative strength in the XLY appears to represent a relative bullish wedge breakout. I believe the only thing we're missing is an absolute breakout on the XLY above 185. Should we get that, I will be fully expecting the XLY to outperform in Q4 and into 2022.
On Monday, I'll be providing my favorite industry groups for Q4 within the consumer discretionary sector in my FREE EB Digest newsletter. It's simple to register; just enter your name and email address HERE and join our community of thousands of traders. There is no credit card required and you may unsubscribe at any time.
Enjoy your weekend and happy trading!
Tom


