Congratulations! We've made it through the first 10 days of September mostly unscathed. At the time of this writing, the S&P 500 is down slightly more than 0.50% month-to-date. Momentum remains fairly strong and the trend is up, so why should we worry? Well, let's cast aside the historical consequences of September for a moment and simply focus on next week -- options expiration week.
Options Expiration Effect
When the stock market rises continually, there is typically a TON of net in-the-money call premium on the table as we approach options expiration Friday each calendar month. While I'd suspect that market makers go long individual stocks to protect themselves as they sell calls to retail buyers, there's still the opportunity to make money on the long side with these stocks as they move higher into options expiration, then sell their positions and even begin shorting to create overhead supply. This very short-term supply vs. demand imbalance sends stocks lower, and market makers cash in on the short side. So they make money on their long positions as stocks rise, then take those profits by selling and create temporary oversupply from shorting and making money as prices drop. And guess what? That fall in price eliminates significant amounts of net in-the-money call premium. It's a magic show and market makers are Houdini.
Visually, you can see it take place nearly every month in 2021. Here's a 1-year chart of the S&P 500:
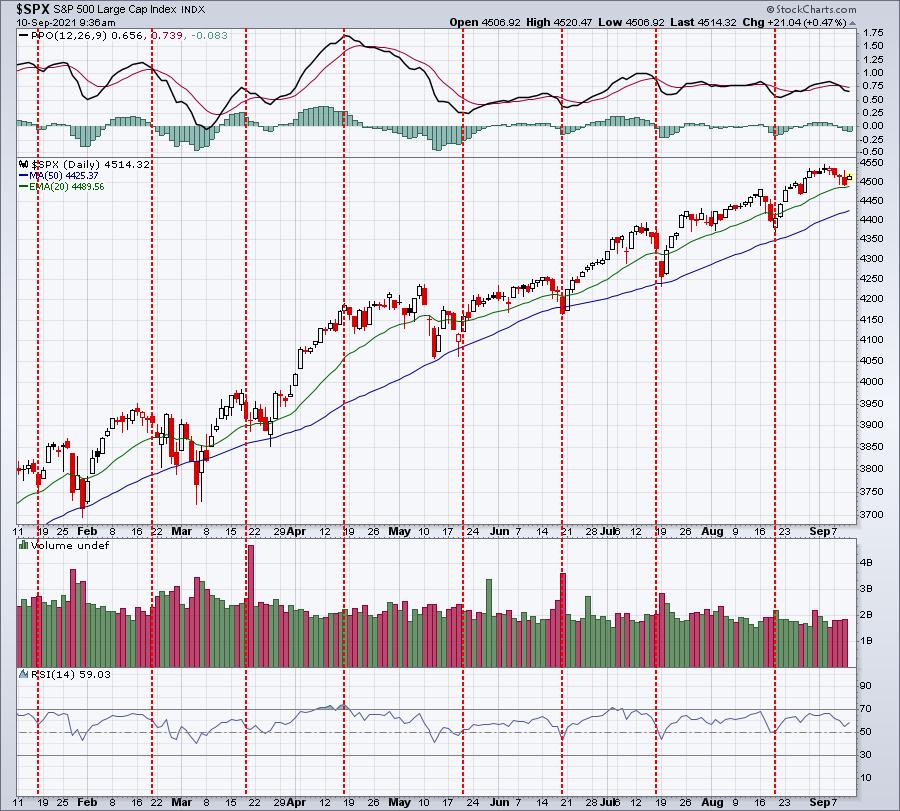
The red-dotted vertical lines highlight Friday options expiration day each month. Just take a moment to look at where most of the profit taking occurs. It's either just before options expiration.....or sometimes just after. If you're asking why would selling occur after options expire, you need to simply remind yourself of what happens at options expiration. Call buyers have the option of exercising their options and buying the stock at their strike price. Market makers, who sold the call, become short sellers of that security when calls are exercised. They make money when the stock later moves lower, which is why the stock market can struggle during the week after options expire.
Since 1950, the S&P 500 has produced annualized returns as follows throughout the calendar month (all calendar months, not just September):
- 26th through 6th: +21.77%
- 7th through 10th: -4.04%
- 11th through 18th: +13.29%
- 19th through 25th: -8.51%
There is an ABSOLUTE pattern that has been in play for DECADES. Ignore it at your own risk. I've discussed the reasoning behind these trading patterns in other articles.
Again, congratulations to all for escaping the wrath of September thus far, but just keep in mind that one factor that hasn't kicked in just yet is options expiration. That's next week, so any extended selling, in my opinion, will likely occur over the next 1-2 weeks based on historical performance around monthly options expiration.
September History
Okay, fasten your seat belts because this isn't pretty. The first thing to understand about September is that it's the only calendar month that has ended lower than it began more often than the other way around. September has finished the month higher 32 times and lower 38 times over the past 70 years. So those odds alone suggest we have a higher probability of moving lower, right? Even during the current secular bull market, which I believe started on April 10, 2013, the day that the S&P 500 cleared the double top from 2000 and 2007, September has provided challenges. Since 2013, September has ended higher 4 times and lower 4 times. The average return has been -0.15%. Keep in mind that we've been in an excellent bull market since 2013, despite suffering through two cyclical bear markets (Q4 2018 trade war and the pandemic-related 2020 selloff). The only calendar month that's been worse than September during the current secular bull market has been March.
But not every day or week in September has performed equally. In fact, since 1950, here's the annualized return in September, broken down by the first and second halves:
- September 1-16: +9.98%
- September 17-30: -22.49%
If we look at the current secular bull market (2013-2020), the annualized returns for these same two periods is as follows:
- September 1-16: +12.54%
- September 17-30: -15.34%
So while we've been in this very bullish secular bull market, the September "first half vs. second half" pattern has continued. It's a reason to at least be cautious, especially as we approach the end of next week (next Friday - options expiration day - is September 17th, which marks the beginning of this bearish 2nd half of September period).
But even within the "second half" of September, the truly bearish period runs from September 20th through September 26th. That marks the ONLY 7 consecutive-day period throughout the year where annualized returns are negative EVERY day. The annualized return just for these 7 calendar days?
- Since 1950: -38.89%
- Since 2013 (current secular bull market period): -36.46%
Protecting Against September Weakness
The obvious question, after digesting all of the above information, is "what should we do to protect ourselves and our portfolios?" First, let me say that history does not guarantee us anything. There have been years when September has not been bearish at all. During the late-1990s secular bull market, September was stellar, rising every year from 1995 through 1998. While the September 20th through September 26th period overall has been extremely bearish, there have been exceptions to the rule. And while the S&P 500 has dropped 7 of 8 years since 2013 during that September 20th through September 26th period, most of the drops have been 1% or less. That equates to perhaps a 45-point drop in the S&P 500, so I'm not talking about an upcoming crash. It's just that the tendency has clearly been to the downside.
If this downward tendency is concerning to you, there are ways to mitigate the risk. The first and most obvious way is to simply build cash around the middle of the month so that you have less exposure. If you want to remain invested, then possibly consider the historical performance of the various sectors. I calculated the annualized returns of all sectors during the September periods I've been discussing, but only during the secular bull market since 2013, so we can compare these sector results against the benchmark S&P 500. Let's start with the first half vs. second half of September -- annualized returns (the S&P 500 return is in bold for comparison purposes):
September 1-16:
- Industrials (XLI): +50.30%
- Materials (XLB): +33.14%
- Health Care (XLV): +25.48%
- Financials (XLF): +23.03%
- Energy (XLE): +17.06%
- Consumer Staples (XLP): +14.65%
- Consumer Discretionary (XLY): +14.43%
- S&P 500 ($SPX): +12.54%
- Utilities (XLU): +7.68%
- Real estate (XLRE): +5.22%
- Communication Services (XLC): +4.26%
- Technology (XLK): -2.73%
September 17-30:
- Technology (XLK): -5.32%
- Consumer Discretionary (XLY): -13.35%
- Utilities (XLU): -13.75%
- S&P 500 ($SPX): -15.34%
- Communication Services (XLC): -15.70%
- Real Estate (XLRE): -17.67%
- Consumer Staples (XLP): -26.63%
- Industrials (XLI): -27.74%
- Financials (XLF): -31.58%
- Health Care (XLV): -37.88%
- Materials (XLB): -42.61%
- Energy (XLE): -65.70%
There are a few things that stand out to me. First, and perhaps surprisingly, technology (XLK) is the only sector that historically doesn't gain ground in the first half of September. The second is maybe even more surprising. When S&P 500 performance turns ugly in the 2nd half, the XLK is the BEST performing sector by a fairly wide margin. It's as if any selling of technology by retail traders is scooped up by professionals, knowing that Q3 earnings results are just around the corner in October. My third takeaway is that investing in defensive sectors really offers little protection, as utilities (XLU) is the only defensive sector that has outperformed the benchmark in that latter half of September.
Conclusion
Based on all of the above, I'd definitely consider some precautions over the next couple weeks. Make no mistake about it, I remain VERY bullish through year-end. At the beginning of 2021, I provided a year-end target of 4700 on the S&P 500 and I believe we'll get there. I think there's even an outside shot of approaching 5000 before year-end. Few analysts have been more bullish than me. But it would be irresponsible to ignore the historical trends that we've seen in September. For that reason, I'd consider raising more cash into next week, especially those with a short-term mindset. We are likely to see significant selling at some point over the next couple weeks based on options expiration and seasonality, and I want to have cash on hand to grab some bargains on any selling.
As we move into October, I fully expect that we'll see yet another pre-earnings surge in U.S. equities as companies continue to bury revenue and EPS estimates that are ridiculously low-balled.
If you're interested in taking advantage of market maker related manipulation around options expiration, then consider joining me for my monthly "Max Pain" webinar that will be held on Tuesday, September 14th at 4:30pm ET. Last month, we nailed several trading candidates and we'll be looking for another batch of trading candidates for this week. CLICK HERE to start your FREE 30-day trial. We'll send out room instructions to all of our members, including trial members, on Tuesday.
We also have a free newsletter, our EB Digest, that's published 3x per week. There's no credit card required and you may unsubscribe at any time. I'll be providing our community a historical trading stat that all traders absolutely should be aware of. Simply provide us your name and email address HERE and I'll get that newsletter and historical fact out to you on Monday!
Happy trading!
Tom


