
Like many traders, I have a few "go to" technical indicators I rely on when making trading decisions. One that I have found to be extremely useful over the years is the Relative Strength Index, better known as the "RSI".
Investopedia says, "The Relative Strength Index is a measurement used by traders to assess the price momentum of a stock or other security." The RSI is plotted on a scale of 0 to 100, so, in theory, the lower the RSI, the more oversold a stock is, while the higher the RSI, the more overbought a stock is. In my experience, once the RSI on a stock dips below 30, it is considered oversold, while a RSI above 70 indicates it is overbought.
For an example of a stock that became extremely overbought, take a look at the chart below on Gamestop (GME), a stock well known to a lot of people when it went from $20 to $483 over the course of a few weeks earlier in the year.
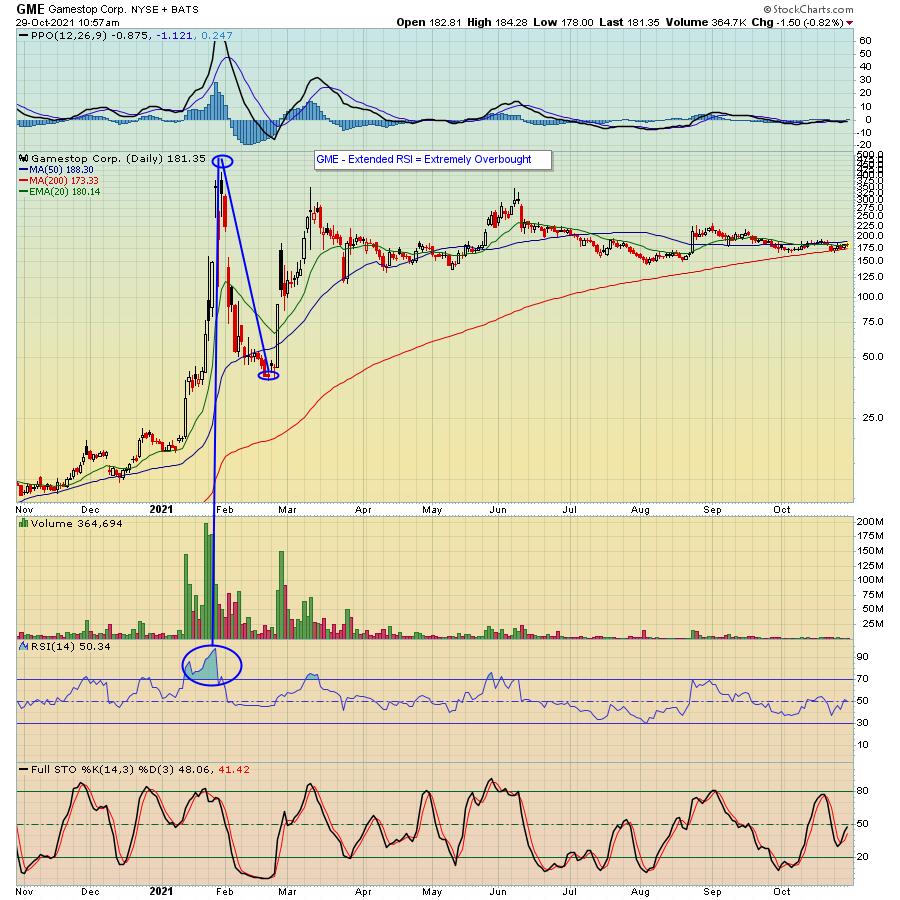
In the case of GME, the RSI exceeded 90 when the stock hit its peak in late January, and I point your attention to what I like to refer to as a "Blue Cloud" that showed how violently overbought the stock had become. As a result, the stock fell from the peak of $483 to back to the $38 range in just a few weeks.
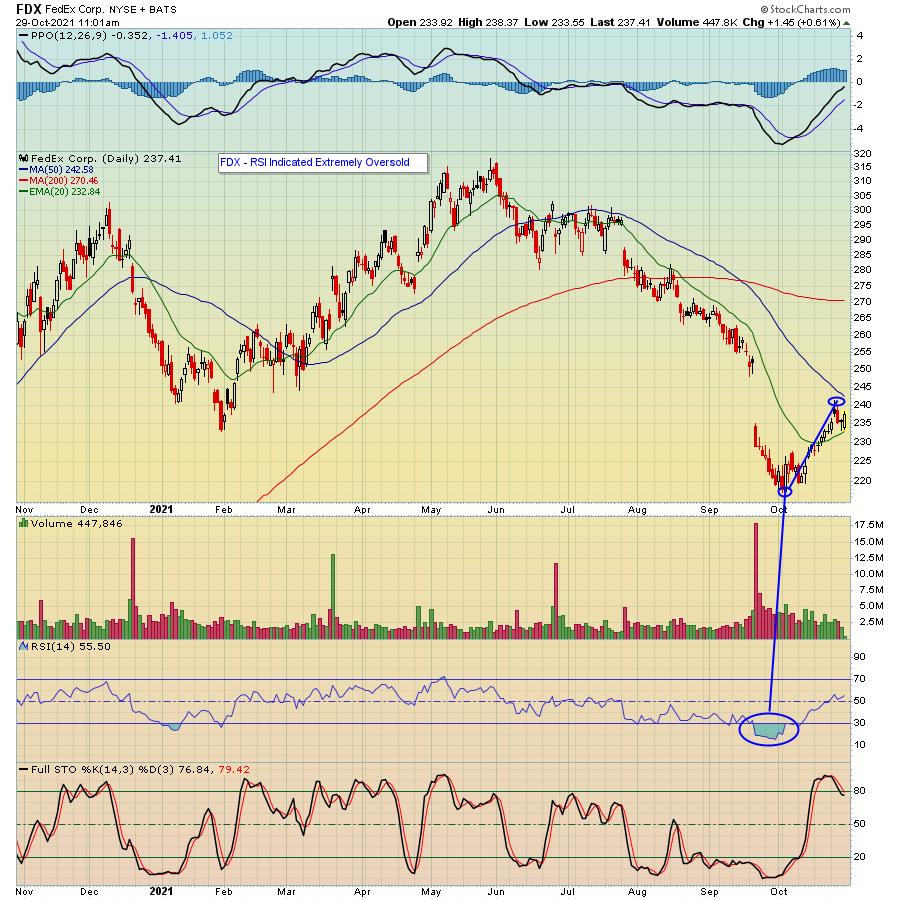
On the flip side, take a look at the chart below on FedEx Corp (FDX), which fell as low as $216 earlier this month. Notice the Blue Cloud where the RSI fell close to 15, showing an extreme oversold condition, with the stock finally reversing to the upside.
I want to point out that a stock can stay oversold or overbought for an extended period of time. But, when the Blue Cloud reaches extreme levels -- below 20 (oversold) or above 80 (overbought) -- it can be a time to start a long or short position. And if you tend to be more conservative, perhaps consider averaging in once you decide to take the plunge.
Like all technical indicators, nothing is 100% guaranteed, especially when you have a stock that has great momentum and is in favor. For example, take a look at the chart below on Tesla (TSLA) that recently reported strong earnings and has exploded to the upside.
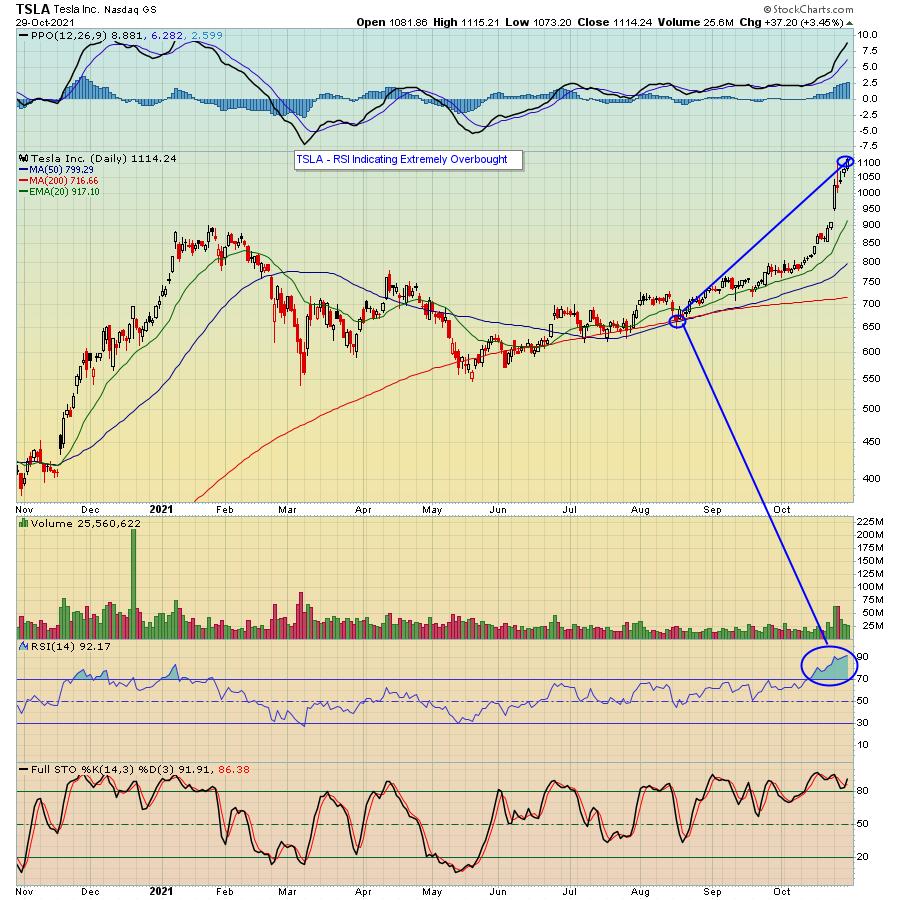
As you can see, the Blue Cloud is showing TSLA has reached extreme overbought levels. Does this mean it's a short? Maybe, but you need to weigh the reward to risk, especially given the current momentum.
But I have had a lot of success on both the long and short side by trading those stocks where the RSI got to extreme levels. Even better is when you have stochastics that confirm an oversold/overbought condition. So, in the case of GME above, stochastics were also extended, while in the case of FDX, stochastics were extremely low. Hence the significant move in both stocks. In the case of TSLA, stochastics are flashing overbought as well.
I want to point out again that I personally have found the RSI to be a reliable technical indicator. Each trader has their own favorites. So you can decide if you want to add this particular indicator to your trading toolbox. In the meantime, if you would like to keep up with important earnings and market developments, sign up for our FREE newsletter, the "EarningsBeats Digest" featuring timely information from our Chief Market Strategist Tom Bowley. Just click here to get started.
At your service,
John Hopkins
EarningsBeats.com


